Fig. 20
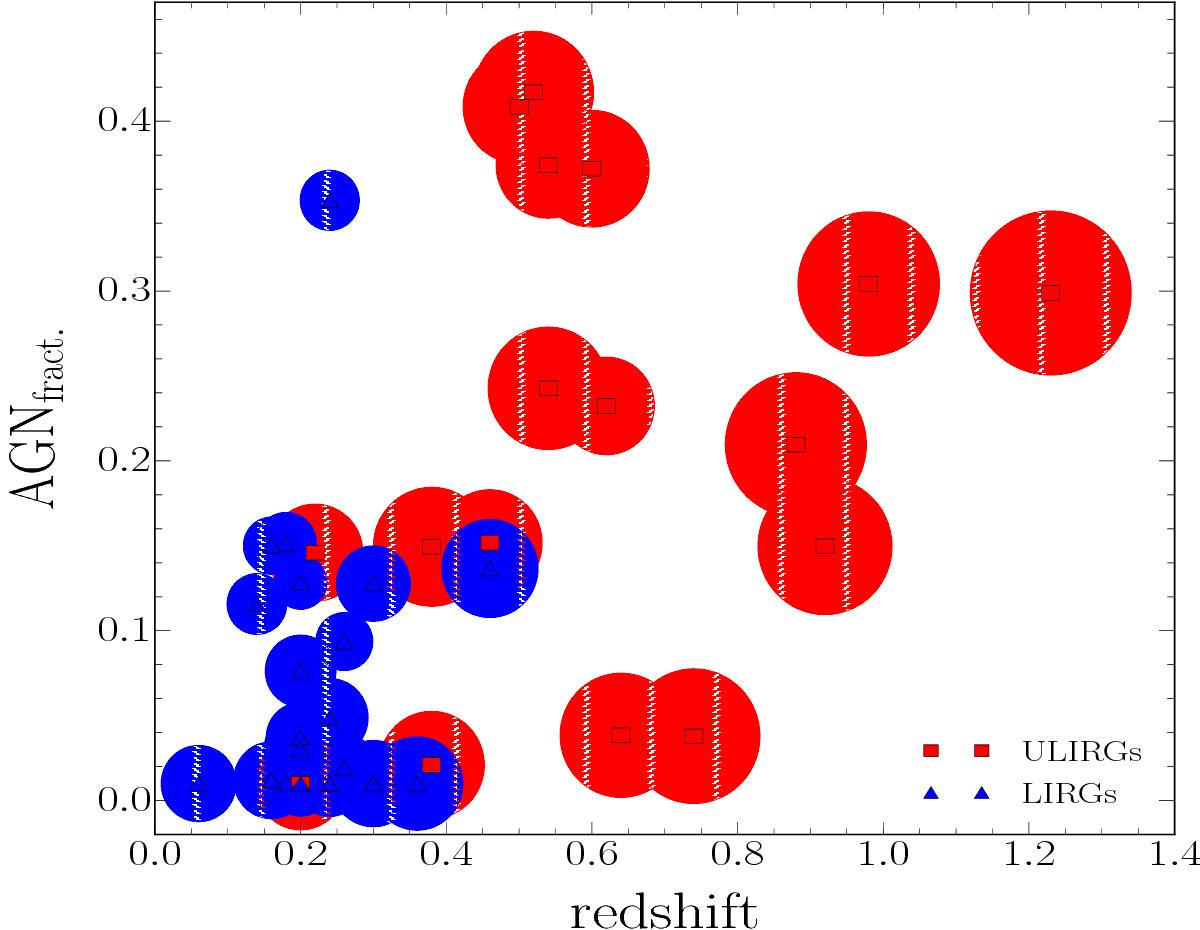
Relationship between redshift and fractional contribution of AGN MIR emission for ULIRGs and LIRGs from the ADF–S sample. Filled red squares represent ULIRGs, while filled blue triangles represent LIRGs. The radii of circles correspond to the log(SFR) values for each galaxy (we used this as a scaling factor), that is, the larger the circle, the higher the measured SFR of the galaxy.
Current usage metrics show cumulative count of Article Views (full-text article views including HTML views, PDF and ePub downloads, according to the available data) and Abstracts Views on Vision4Press platform.
Data correspond to usage on the plateform after 2015. The current usage metrics is available 48-96 hours after online publication and is updated daily on week days.
Initial download of the metrics may take a while.