Fig. 17
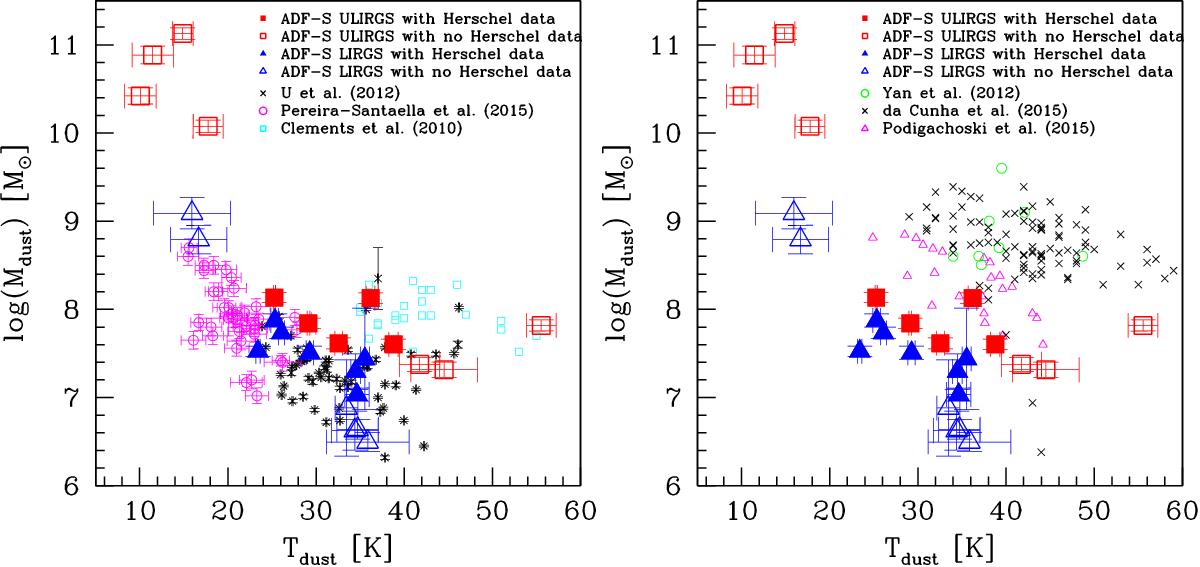
Dust luminosity versus dust mass for local (left panel) and hight redshift LIRGs and ULIRGs (right panel). Red squares represent LIRGs, while blue triangles – ULIRGs from the ADF–S sample (empty symbols present object without Herschel data). Left panel: black crosses represent LIRGs and ULIRGs from U et al. (2012), and open pink circles correspond to the Pereira-Santaella et al. (2015) sample of LIRGs. Right panel: open green circles represent Yan et al. (2014) ULIRGs, black “x-s” – LIRGs and ULIRGs from da Cunha et al. (2015), open pink triangles represent Podigachoski et al. (2015) sample of LIRGs and ULIRGs, and open cyan squares – Clements et al. (2010) sample of ULIRGs. The errorbars of da Cunha et al. (2015) data were not shown since they are very large and make the plot unreadable.
Current usage metrics show cumulative count of Article Views (full-text article views including HTML views, PDF and ePub downloads, according to the available data) and Abstracts Views on Vision4Press platform.
Data correspond to usage on the plateform after 2015. The current usage metrics is available 48-96 hours after online publication and is updated daily on week days.
Initial download of the metrics may take a while.