Fig. 15
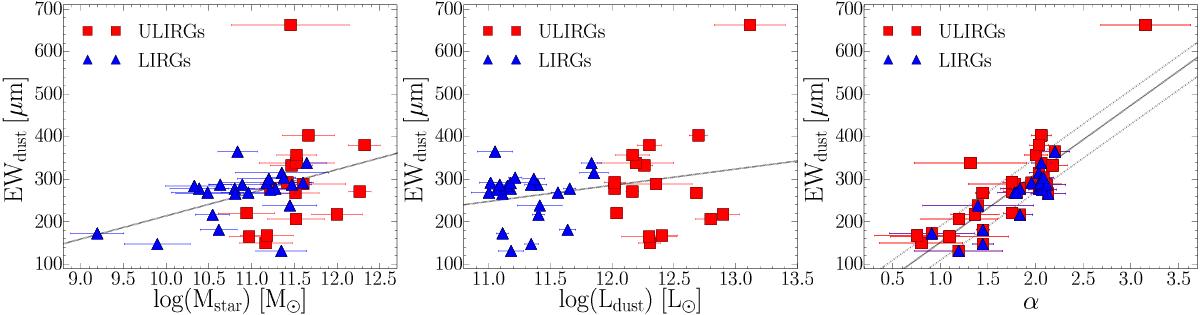
Relationship between dust spectra peak equivalent width and stellar mass (left panel), dust luminosity (central panel), and Dale et al. (2014)α parameter (right panel). Filled red squares represent ULIRGs, and filled blue triangles correspond to LIRGs. The most extreme value of EWdust was found for the most distant object in the ADF–S sample (z = 1.23): a quasar HE 0435-5304. The dashed line represents the linear fit to the data. In the α–EWdust relation (right panel) 2σ uncertainties for the fitted line (Eq. (7)) were added (solid gray lines).
Current usage metrics show cumulative count of Article Views (full-text article views including HTML views, PDF and ePub downloads, according to the available data) and Abstracts Views on Vision4Press platform.
Data correspond to usage on the plateform after 2015. The current usage metrics is available 48-96 hours after online publication and is updated daily on week days.
Initial download of the metrics may take a while.