Fig. 1
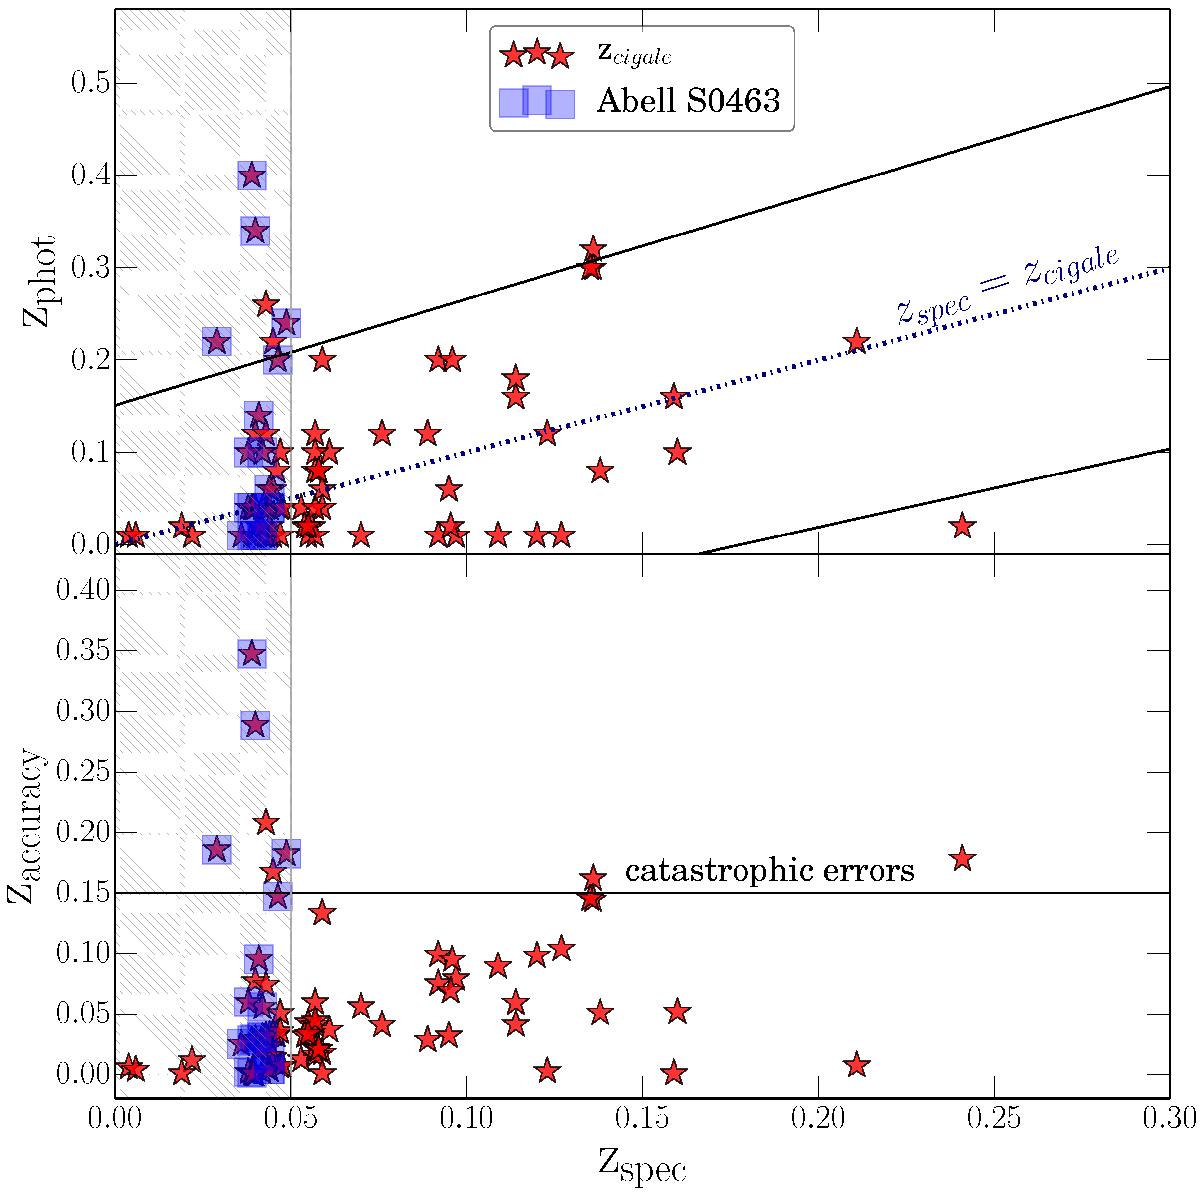
Photometric versus spectroscopic redshifts and redshift accuracy versus spectroscopic redshift for a sample of 84 galaxies (red stars) for which the photometric redshift was calculated by Małek et al. (2014) using the CIGALE tool. Blue squares correspond to the Abell S0463 cluster. The region of CEs, defined as | zspec−zphoto | /(1 + zspec) > 0.15 (Ilbert et al. 2006), is marked by a solid black line. The navy dashed-dotted line corresponds to the zphot = zspec. Shadowed areas represent the redshift range rejected from our analysis.
Current usage metrics show cumulative count of Article Views (full-text article views including HTML views, PDF and ePub downloads, according to the available data) and Abstracts Views on Vision4Press platform.
Data correspond to usage on the plateform after 2015. The current usage metrics is available 48-96 hours after online publication and is updated daily on week days.
Initial download of the metrics may take a while.