Fig. 5
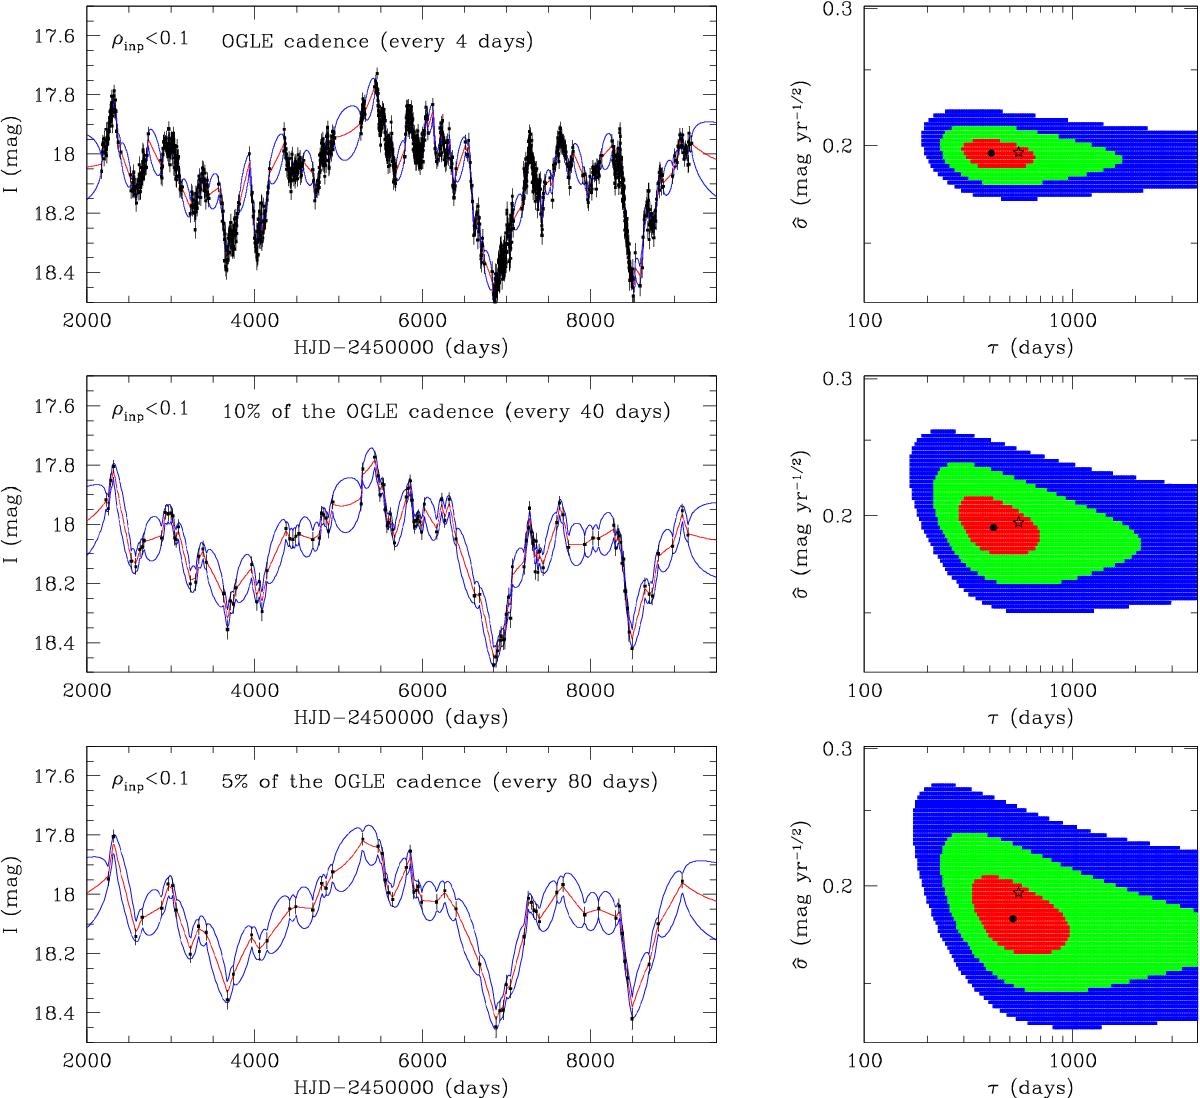
Left column: simulated OGLE AGN light curves spanning 20 years, where we extrapolated the cadence into the future (top). We assumed the AGN to be at z = 0.5 and τ = 1 year, so ρinp = 0.07 (smaller than the limiting ρinp = 0.1). The typical OGLE cadence during observing seasons of LMC is approximately four days. In the middle and bottom panels, we keep only every 10th and 20th point from the upper light curve. The red line is the best-fit DRW model and the blue lines present 1σ “error snakes”. The right column presents the model likelihood surface for the three light curves. The black point is the maximum likelihood point, while the red, green, and blue areas represent Δlnℒ = −0.5, −2.0, and −4.5, corresponding to Δχ2 = 1, 4, and 9 (or 1, 2, and 3σ), respectively. The open star marks the input parameters. In all three cases, the timescale is measured with similar precision and bias, while the uncertainty in the variability amplitude increases because the middle and bottom light curves do not probe the short timescales.
Current usage metrics show cumulative count of Article Views (full-text article views including HTML views, PDF and ePub downloads, according to the available data) and Abstracts Views on Vision4Press platform.
Data correspond to usage on the plateform after 2015. The current usage metrics is available 48-96 hours after online publication and is updated daily on week days.
Initial download of the metrics may take a while.