Fig. 2
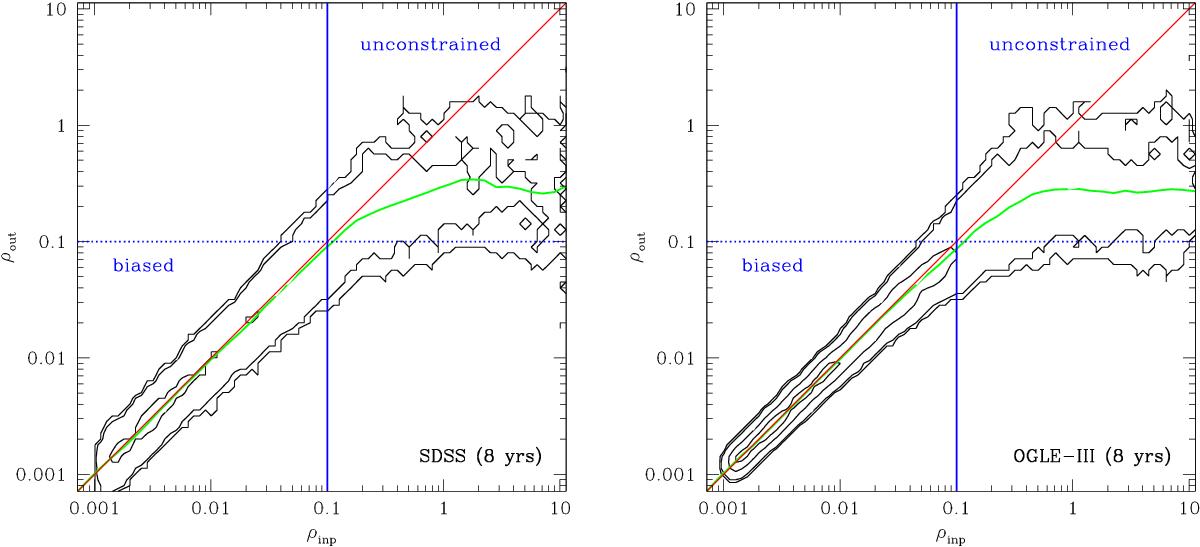
Bias in the DRW decorrelation timescale caused by the experiment length. As contours we present two sets of 10 000 AGN light curve realizations modeled as DRW, SDSS (60 epochs; left) and OGLE-III (445 epochs; right), with SF∞ = 0.20 mag and a wide range of input timescales, where r ≈ 17 mag and I ≈ 18 mag, respectively. AGN light curves that are long compared to the true decorrelation timescale, at least ten times longer (ρinp < 0.1), are the best source of the correctly measured decorrelation timescales (the “biased” region). Light curves that are short and comparable to the decorrelation timescale (ρinp ≈ 1) will not yield reliable decorrelation timescales and they are unconstrained (the “unconstrained” region). The typical measured timescale in the “unconstrained” region is ~20–30% of the experiment span, independent of the input (true) value. The border between the biased and unconstrained regions is ρinp = 0.1. Location of the border line is independent of the input amplitude SF∞ and the source magnitude. While not shown, the typical uncertainty on ρout is half of the outer contours.
Current usage metrics show cumulative count of Article Views (full-text article views including HTML views, PDF and ePub downloads, according to the available data) and Abstracts Views on Vision4Press platform.
Data correspond to usage on the plateform after 2015. The current usage metrics is available 48-96 hours after online publication and is updated daily on week days.
Initial download of the metrics may take a while.