Fig. 1
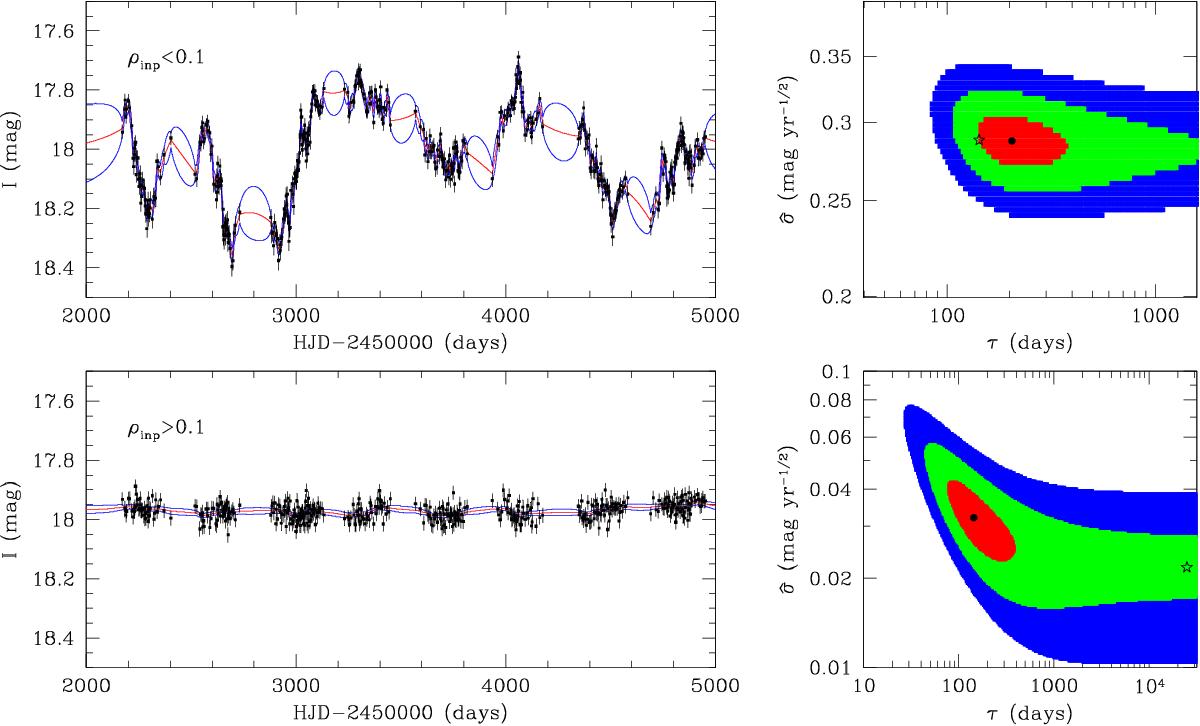
Left column: two examples of simulated AGN light curves for OGLE-III. Both light curves have the mean magnitude I = 18 mag, SF∞ = 0.20 mag, but the input timescale is τinp = 150 d (top) and 25000 d (bottom). The experiment lasted approximately texp = 2800 d. Thus, the ratio of the decorrelation timescale to the experiment length ![]() is 0.05 and 9.0, respectively. The red line is the best-fit DRW model and the blue lines present 1σ “error snakes”. Right column: model likelihood surface for the two light curves. The black point is the maximum likelihood point, while the red, green, and blue areas represent Δlnℒ = −0.5, −2.0, and −4.5, corresponding to Δχ2 = 1, 4, and 9, (or 1, 2, and 3σ), respectively. The open star marks the input parameters. The bias in the measured parameters is obvious in both cases (dots and stars do not match).
is 0.05 and 9.0, respectively. The red line is the best-fit DRW model and the blue lines present 1σ “error snakes”. Right column: model likelihood surface for the two light curves. The black point is the maximum likelihood point, while the red, green, and blue areas represent Δlnℒ = −0.5, −2.0, and −4.5, corresponding to Δχ2 = 1, 4, and 9, (or 1, 2, and 3σ), respectively. The open star marks the input parameters. The bias in the measured parameters is obvious in both cases (dots and stars do not match).
Current usage metrics show cumulative count of Article Views (full-text article views including HTML views, PDF and ePub downloads, according to the available data) and Abstracts Views on Vision4Press platform.
Data correspond to usage on the plateform after 2015. The current usage metrics is available 48-96 hours after online publication and is updated daily on week days.
Initial download of the metrics may take a while.