Free Access
Fig. A.1
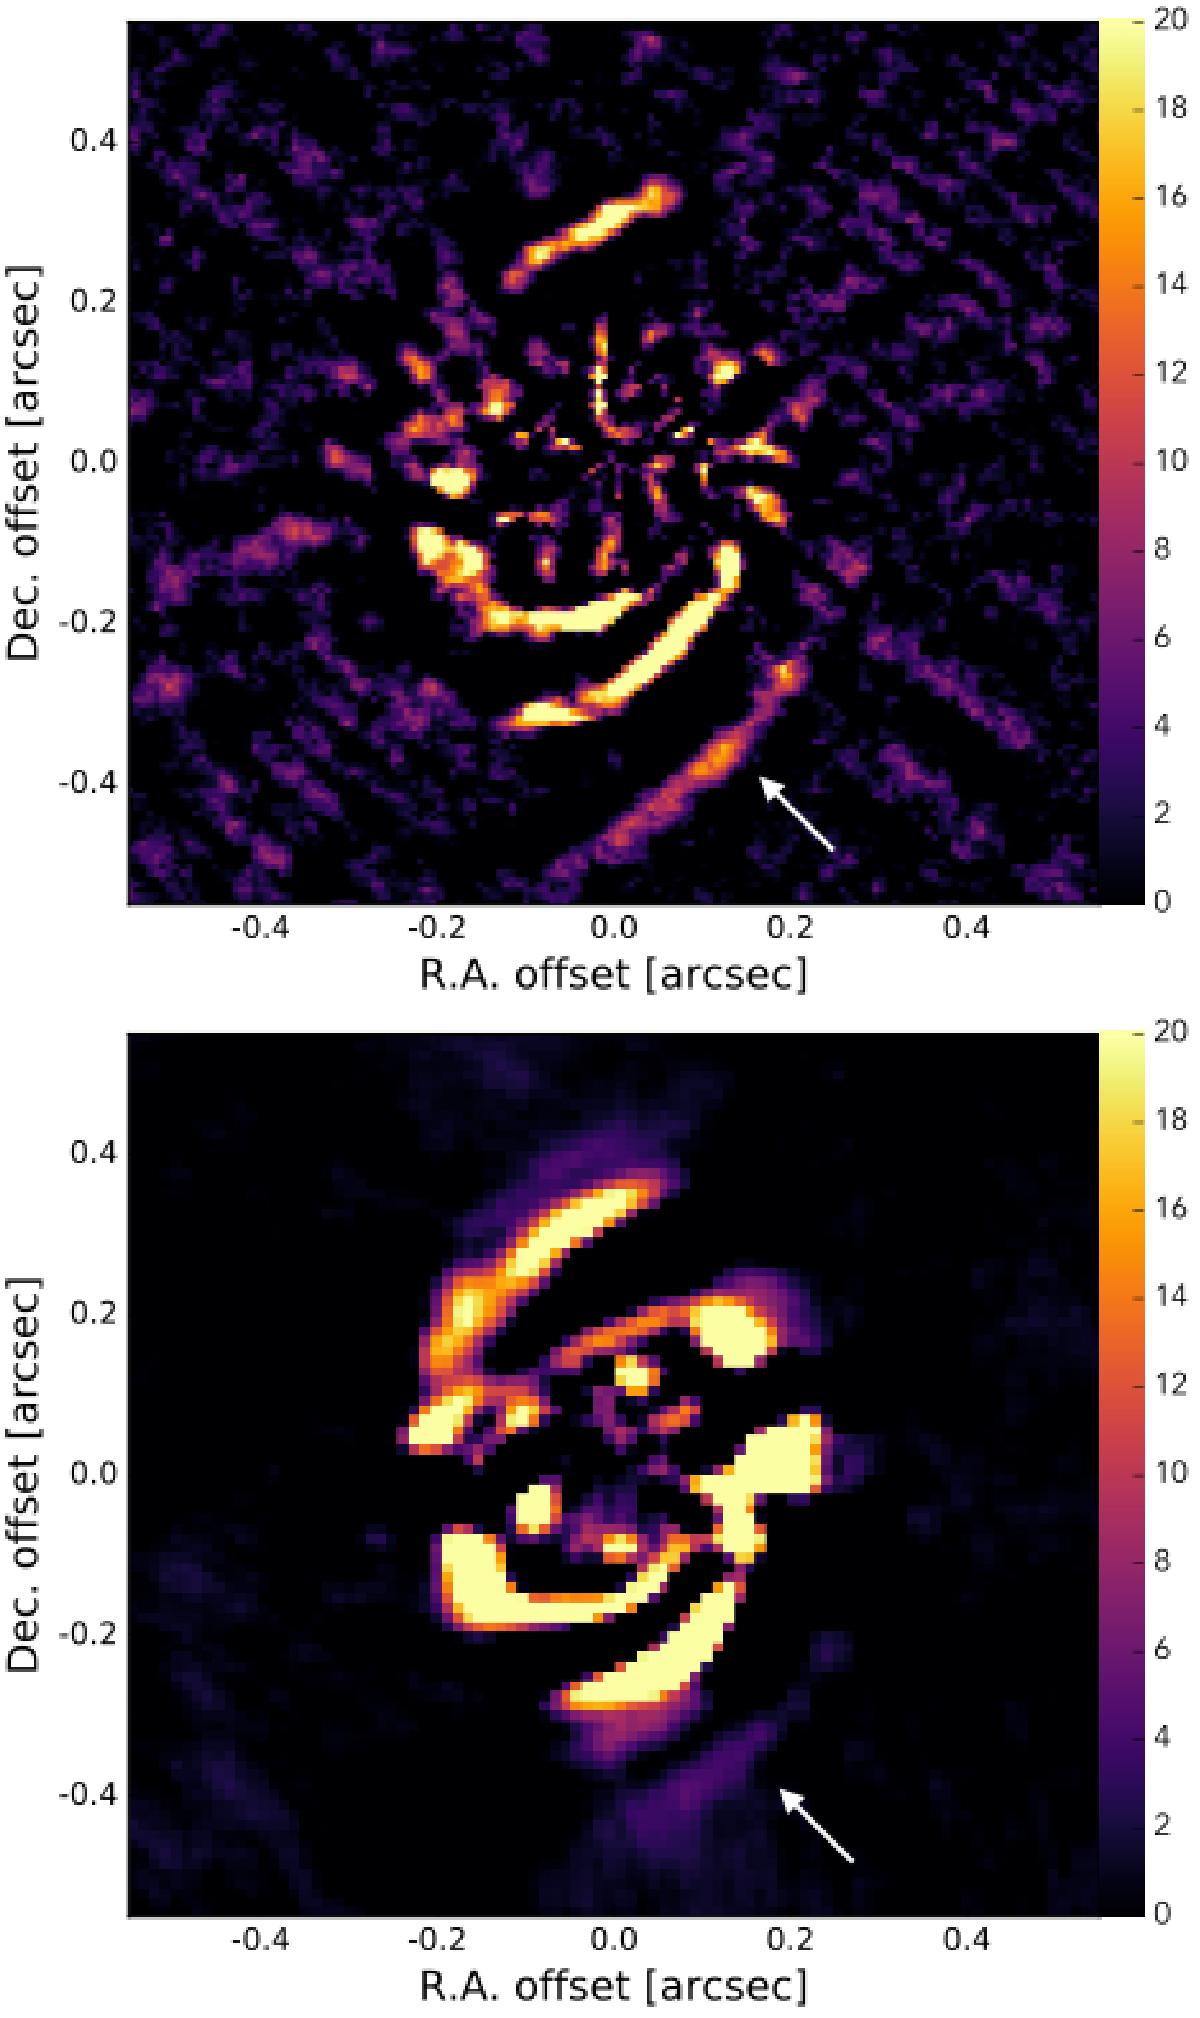
ADI images from 2015 (top, Wagner et al. 2015a) and from 2016 (bottom). The right arrows indicate the location of the faint third spiral-like feature that we interpret as the outer edge of the scattering surface on the bottom side of the disk.
Current usage metrics show cumulative count of Article Views (full-text article views including HTML views, PDF and ePub downloads, according to the available data) and Abstracts Views on Vision4Press platform.
Data correspond to usage on the plateform after 2015. The current usage metrics is available 48-96 hours after online publication and is updated daily on week days.
Initial download of the metrics may take a while.