Fig. 4
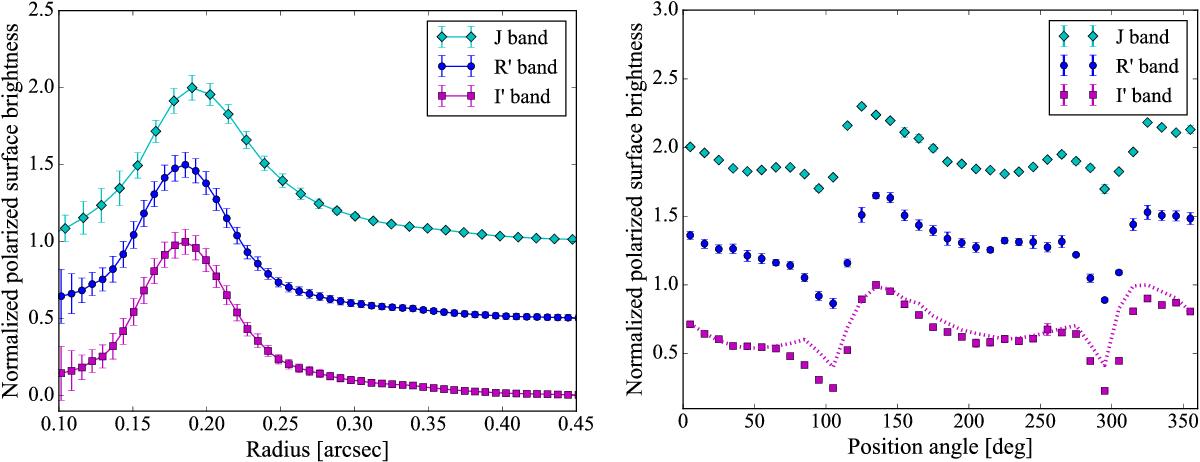
Left: normalized radial cuts of the R′, I′ and J-band images after averaging azimuthally. Right: normalized azimuthal cuts of the R′, I′ and J-band images, after averaging radially between 170 and 200 mas. The radiative transfer model prediction (dotted curve) reproduces the observed azimuthal brightness variations relatively well. Note that due to the large variation of surface brightness along the rim, the standard deviation in each bin can vary from 2 to 17%. The curves are shifted vertically for clarity.
Current usage metrics show cumulative count of Article Views (full-text article views including HTML views, PDF and ePub downloads, according to the available data) and Abstracts Views on Vision4Press platform.
Data correspond to usage on the plateform after 2015. The current usage metrics is available 48-96 hours after online publication and is updated daily on week days.
Initial download of the metrics may take a while.