Fig. 1
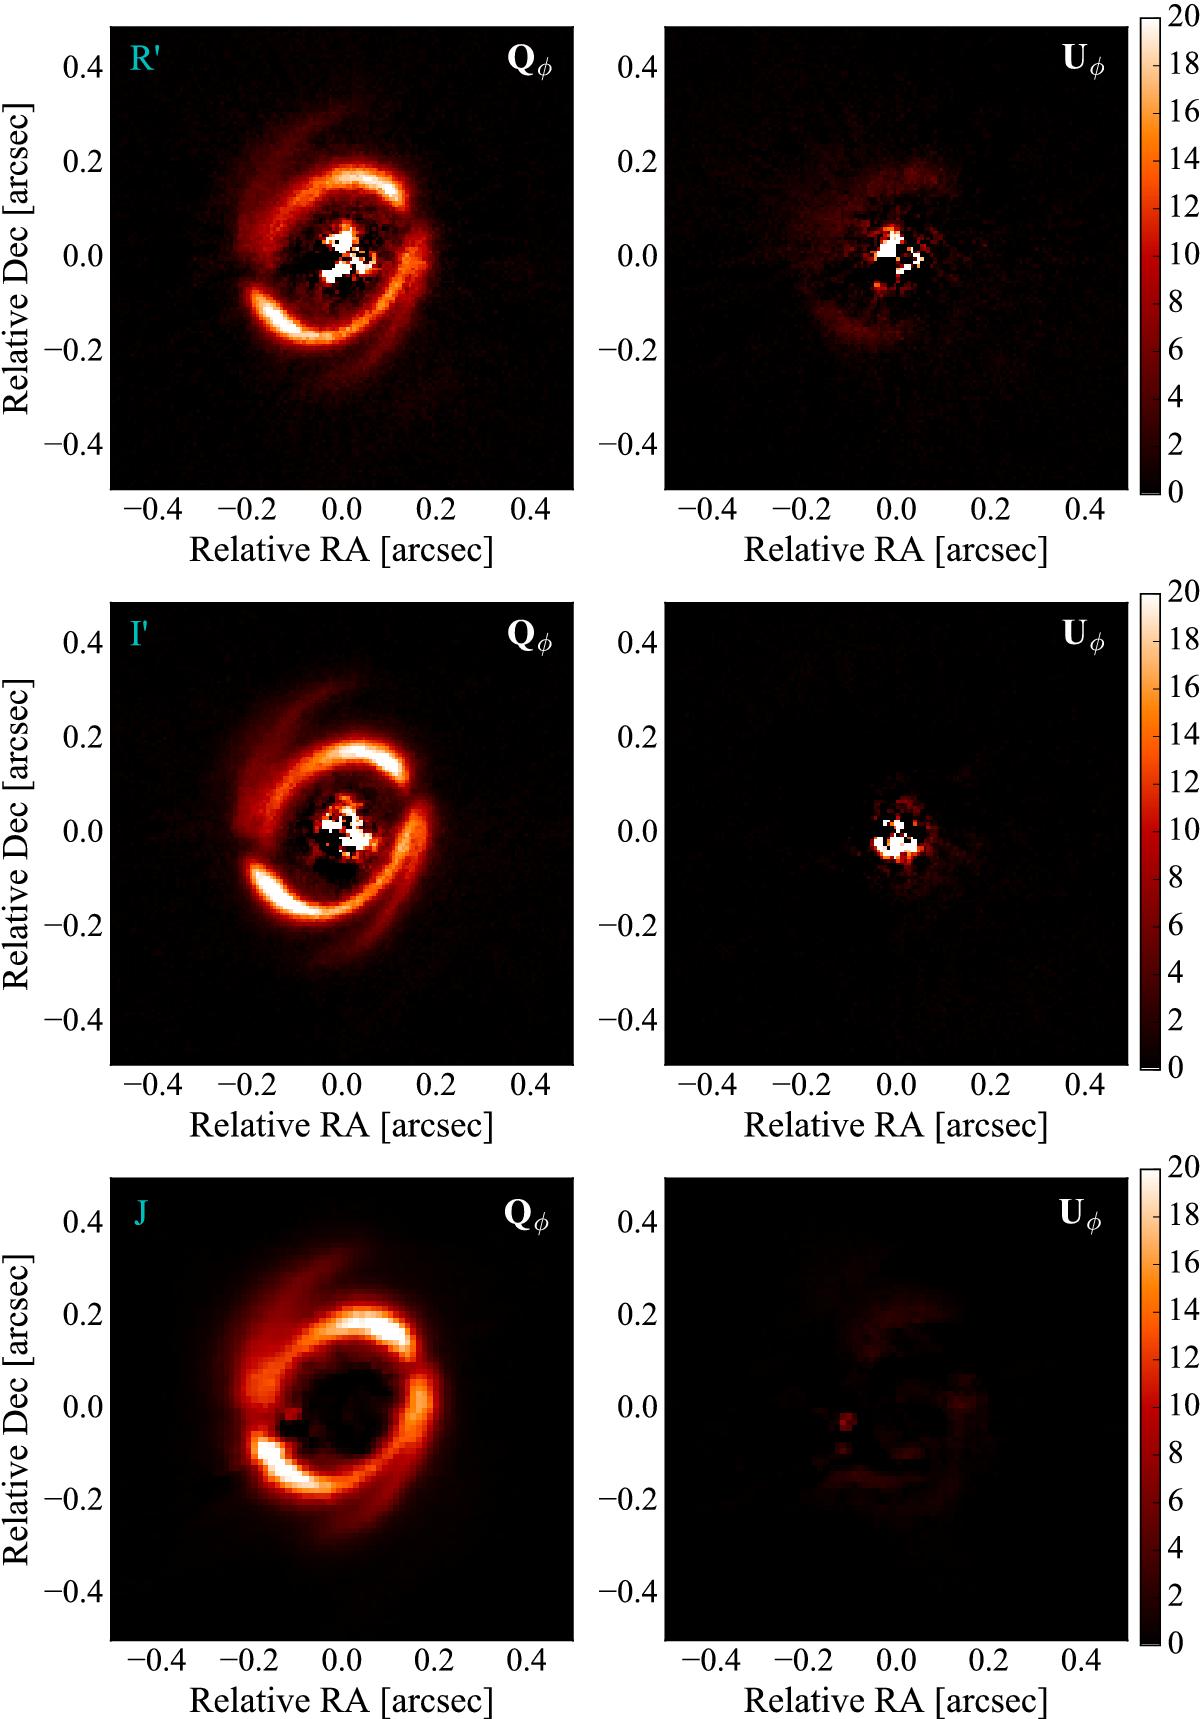
R′ (top), I′ (middle), and J band (bottom) polarized intensity images, Qφ (left) and Uφ (right). In the optical images, the inner bright region corresponds to saturated pixels inside our IWA. In the NIR images, the inner dark region is masked by the coronagraph. The color scale of the Qφ and Uφ are the same, and arbitrary. For all images, East is pointing left.
Current usage metrics show cumulative count of Article Views (full-text article views including HTML views, PDF and ePub downloads, according to the available data) and Abstracts Views on Vision4Press platform.
Data correspond to usage on the plateform after 2015. The current usage metrics is available 48-96 hours after online publication and is updated daily on week days.
Initial download of the metrics may take a while.