Fig. 2
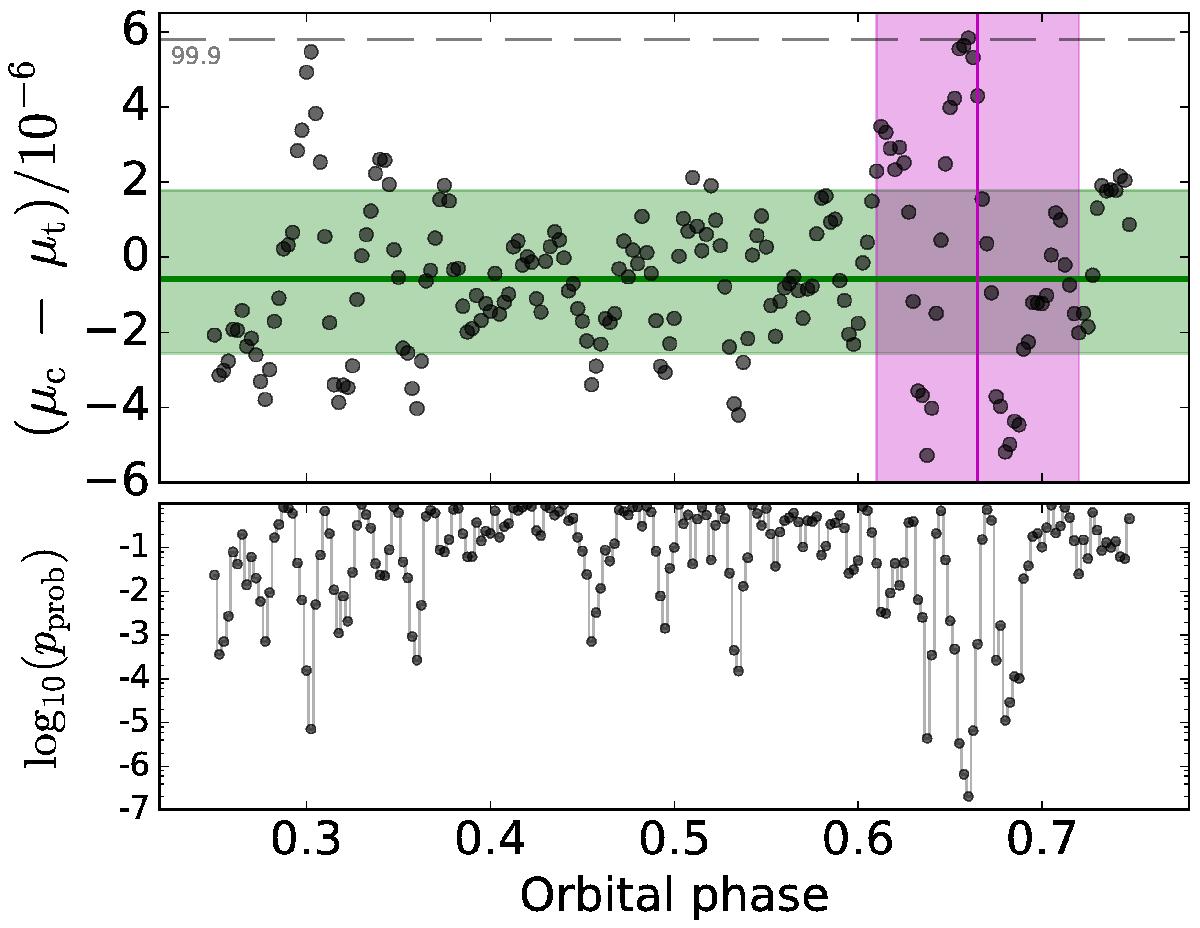
Upper panel: mean of continuum points μc minus mean of in-transit points μt over orbital phase (see Sect. 2.2 for details). The horizontal (green) area marks the range between the 16% and 84% quantiles of the distribution of points, the gray dashed line indicates the 99.9% quantile. The position of the secondary transit of HAT-P-11 b predicted by RV measurements is given by the vertical (magenta) line; the shaded area indicates the ± σ uncertainty of the prediction. Lower panel: estimate of the significance of the measurements in the upper panel using an F-test (see Sect. 2.2 for details).
Current usage metrics show cumulative count of Article Views (full-text article views including HTML views, PDF and ePub downloads, according to the available data) and Abstracts Views on Vision4Press platform.
Data correspond to usage on the plateform after 2015. The current usage metrics is available 48-96 hours after online publication and is updated daily on week days.
Initial download of the metrics may take a while.