Fig. 1
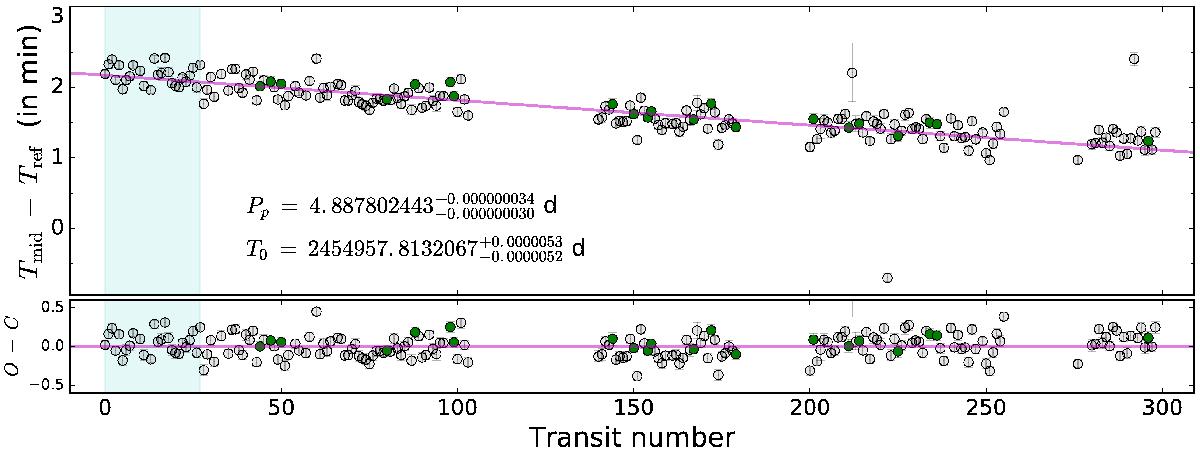
Measurements of mid-transit times from 206Kepler transits. The green filled circles are our selection of 21 low-χ2 transits. The line represents a first-order polynomial fit to the error-weighted measurements. The lower panel shows the residuals with outliers cut-off; the variations are primarily caused by deformations of the transit due to starspots. The shaded area contains the transits that previously have been analyzed by Sanchis-Ojeda & Winn (2011). See Sects. 2.1 and 3.1 for detailed explanations.
Current usage metrics show cumulative count of Article Views (full-text article views including HTML views, PDF and ePub downloads, according to the available data) and Abstracts Views on Vision4Press platform.
Data correspond to usage on the plateform after 2015. The current usage metrics is available 48-96 hours after online publication and is updated daily on week days.
Initial download of the metrics may take a while.