Fig. 1
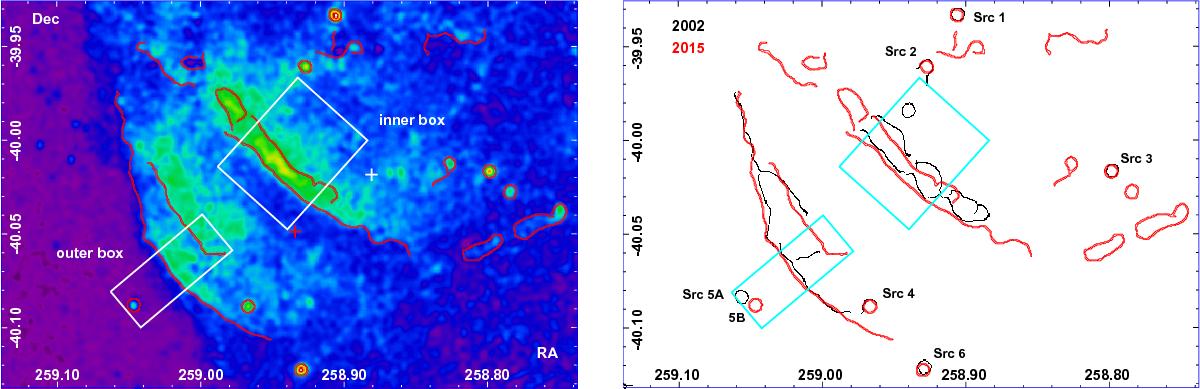
Left panel: exposure corrected and background subtracted count map in the 0.6–6 keV energy band of the 2015 XMM-Newton observation. The image is smoothed with a Gaussian of 20 arcsec kernel radius. The red contours are the results of the Canny edge detection algorithm discussed in the main text. The white boxes represent the regions used to extract the radial profiles shown in Fig. 2 and the white and red crosses the 2002 and 2015 pointing positions. Right panel: edges detected in the 2002 (black) and 2015 (red) observations. The point sources discussed in the image registration process are labeled Src 1 to Src 6.
Current usage metrics show cumulative count of Article Views (full-text article views including HTML views, PDF and ePub downloads, according to the available data) and Abstracts Views on Vision4Press platform.
Data correspond to usage on the plateform after 2015. The current usage metrics is available 48-96 hours after online publication and is updated daily on week days.
Initial download of the metrics may take a while.