Fig. 8
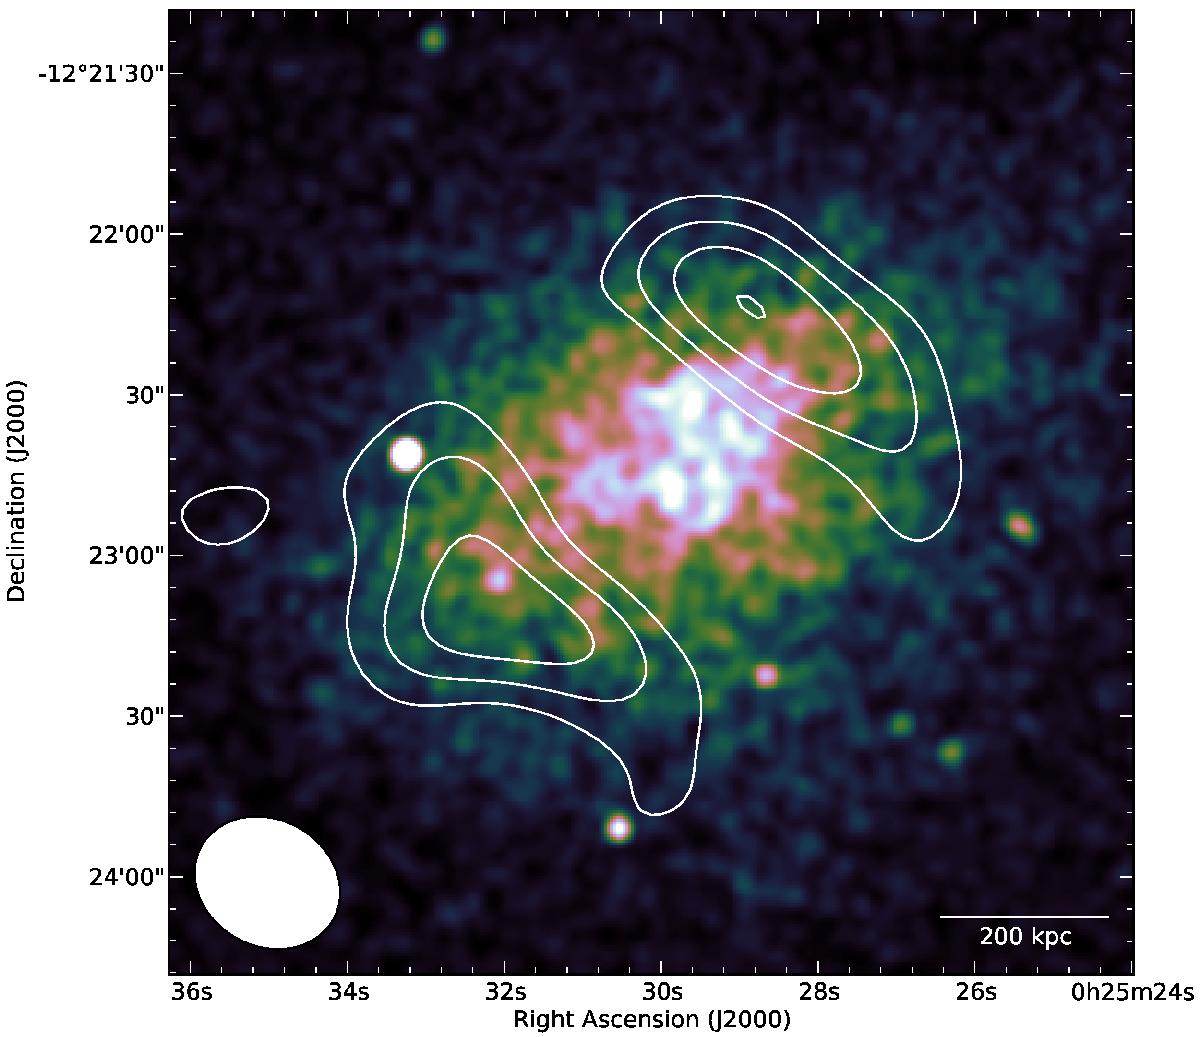
Composite image of MACS0025. Colour plot is X-ray surface brightness as per Fig. 3. Contours are source-subtracted low-resolution GMRT data at 325 MHz, at levels [5, 7, 9, 11] ×σLR, where σLR = 270 μJy beam-1. The synthesised beam in the low-resolution image is 28.2 × 23.7 arcsec at PA 61.2°, indicated by the unfilled ellipse in the lower-left corner.
Current usage metrics show cumulative count of Article Views (full-text article views including HTML views, PDF and ePub downloads, according to the available data) and Abstracts Views on Vision4Press platform.
Data correspond to usage on the plateform after 2015. The current usage metrics is available 48-96 hours after online publication and is updated daily on week days.
Initial download of the metrics may take a while.