Fig. 6
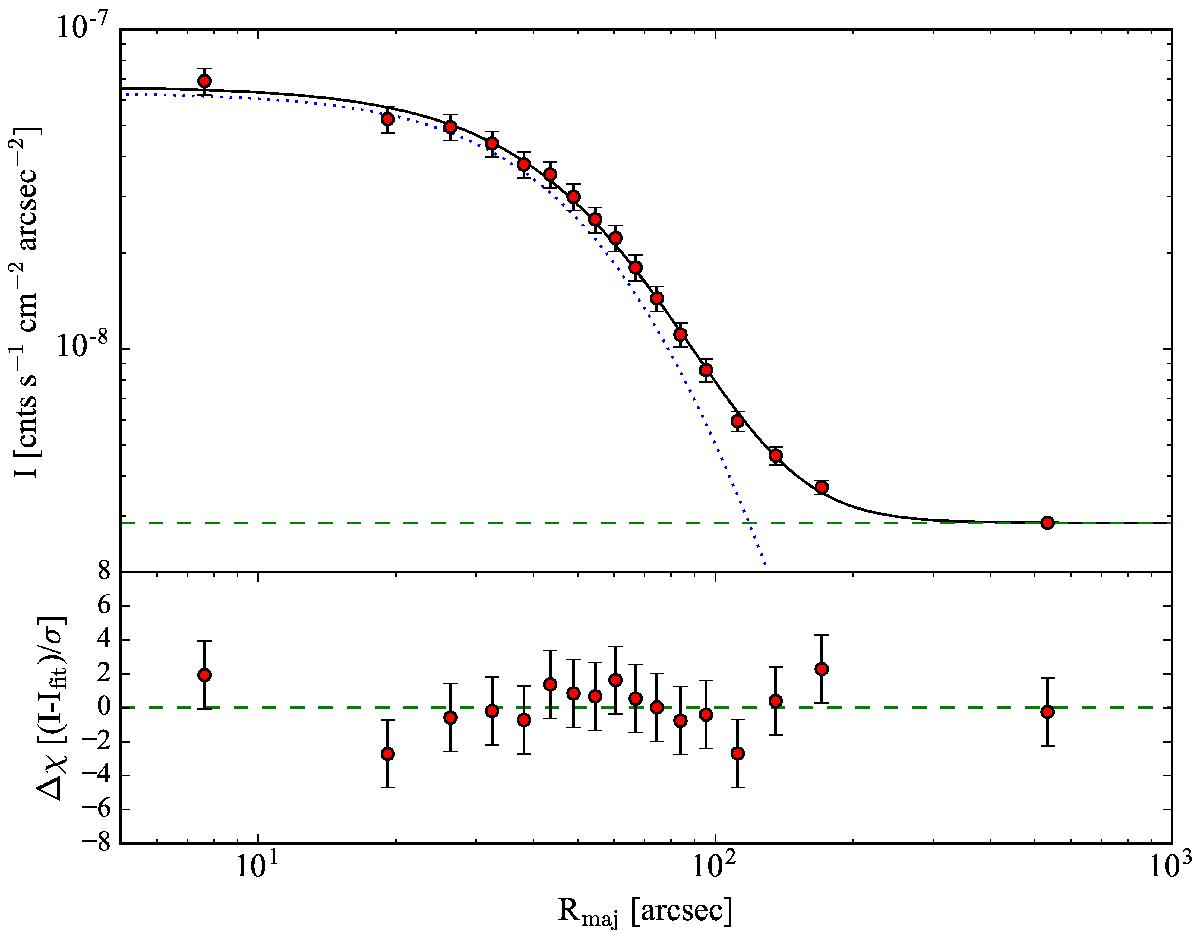
Extracted surface brightness profile for MACS0025. In the upper panel, the solid line shows the best-fit model to the overall surface brightness. The background level is denoted by the horizontal, dashed line while the dotted curve indicates the underlying, background-subtracted model. The lower panel indicates the difference between data and model relative to the error at each radius. For both panels, the radius, Rmaj, corresponds to the radial distance along the semi-major axis of the assumed elliptical distribution. The model is discussed in the text.
Current usage metrics show cumulative count of Article Views (full-text article views including HTML views, PDF and ePub downloads, according to the available data) and Abstracts Views on Vision4Press platform.
Data correspond to usage on the plateform after 2015. The current usage metrics is available 48-96 hours after online publication and is updated daily on week days.
Initial download of the metrics may take a while.