Fig. A.2
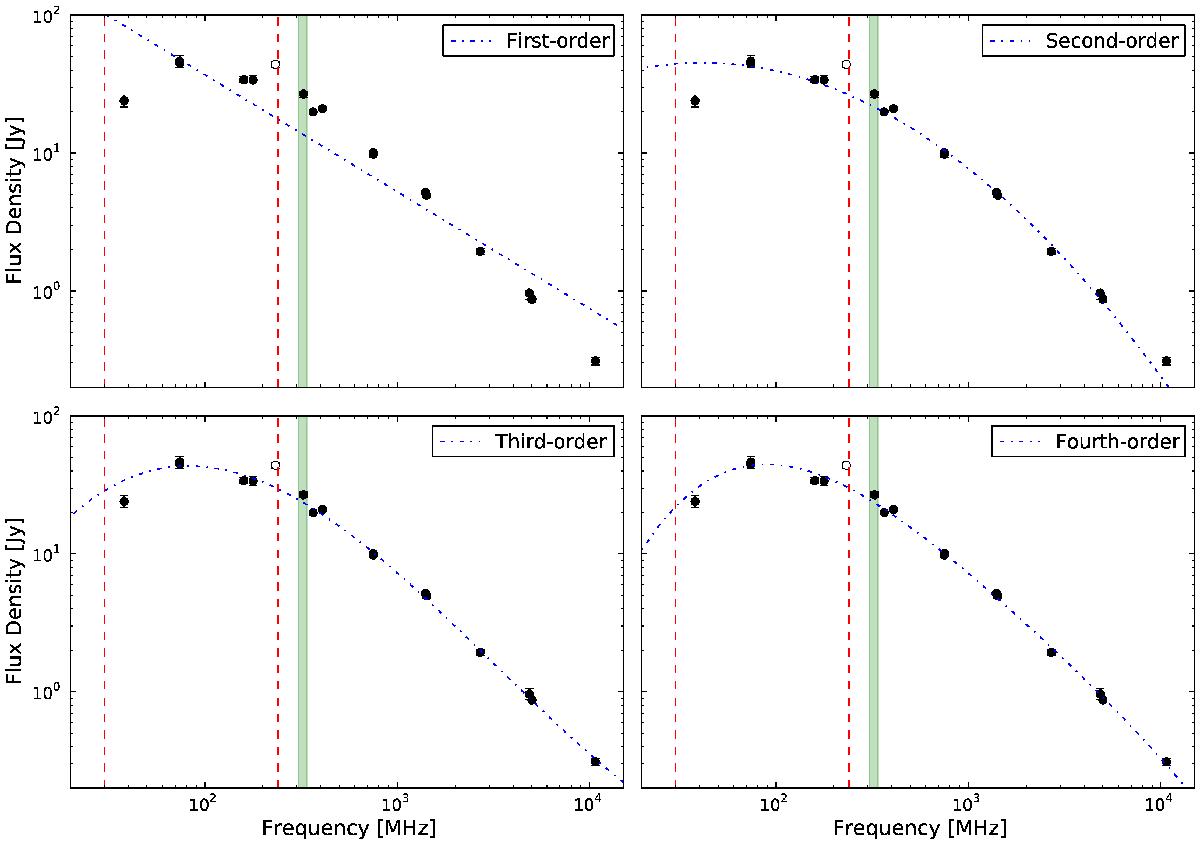
Polynomial spectral index models fitted to 3C 468.1, showing linear, second-, third- and fourth-order polynomial models from left to right. Empty circle indicates measurement from the Miyun survey at 232 MHz which has been excluded from the fit. Shaded green region marks the frequency range covered by the GMRT observations in this work; vertical dashed lines mark the frequency bounds of LOFAR.
Current usage metrics show cumulative count of Article Views (full-text article views including HTML views, PDF and ePub downloads, according to the available data) and Abstracts Views on Vision4Press platform.
Data correspond to usage on the plateform after 2015. The current usage metrics is available 48-96 hours after online publication and is updated daily on week days.
Initial download of the metrics may take a while.