Fig. 11
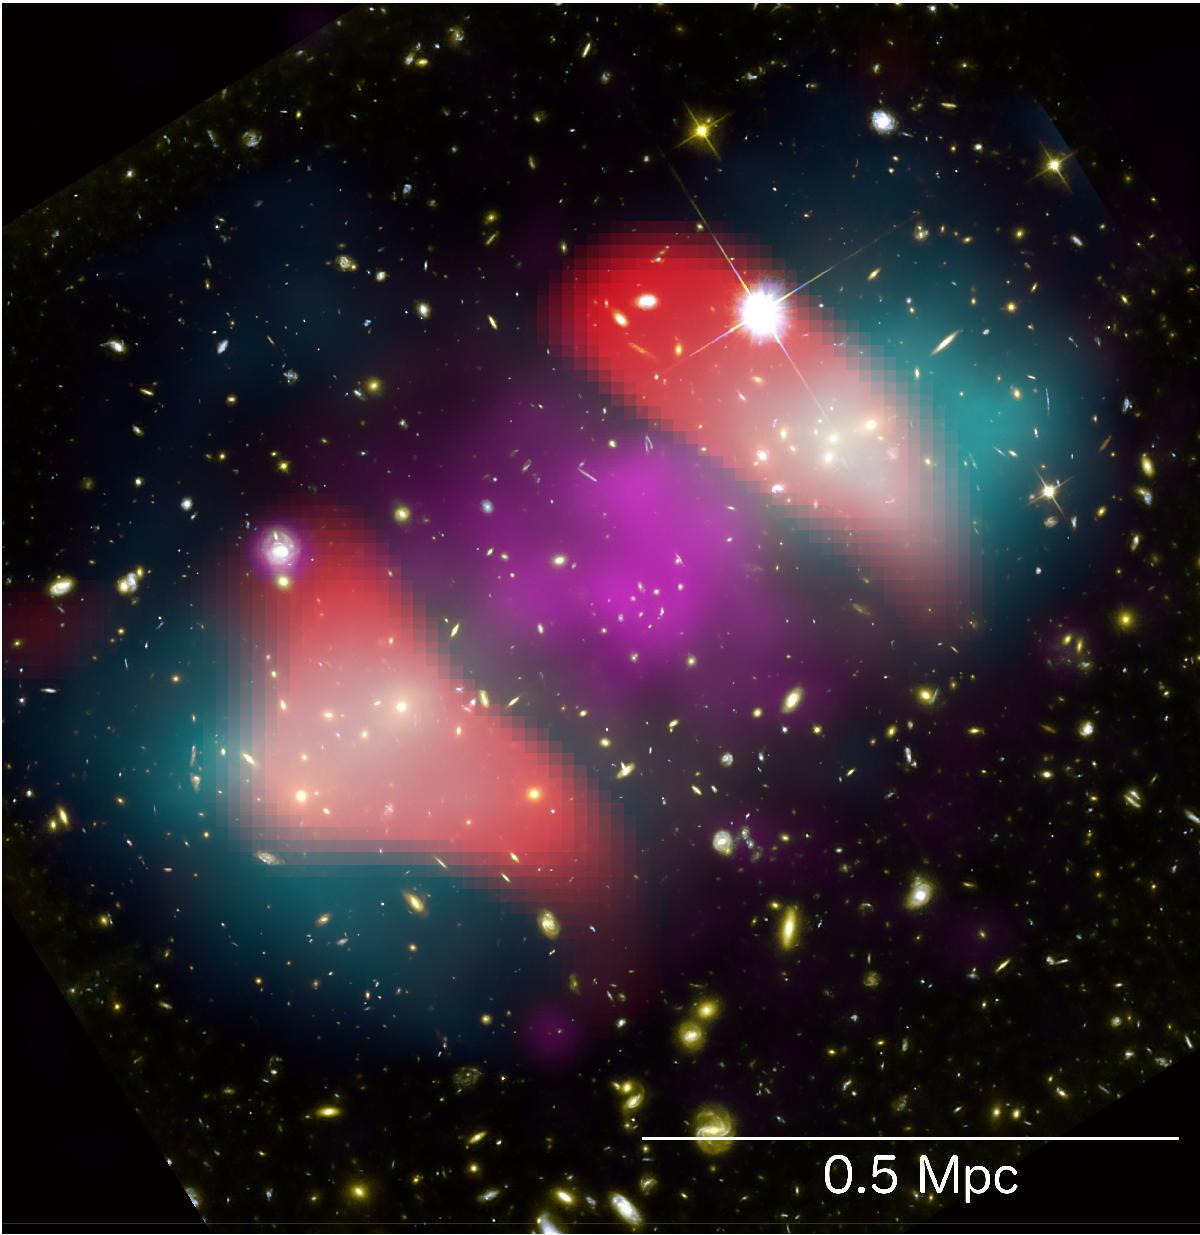
False-colour image of MACS0025. Background image is a RGB optical image from HST. Cyan denotes the total mass distribution traced by lensing (dominated by the dark matter). Purple denotes the baryonic mass distribution (dominated by the ICM plasma). Red denotes the diffuse radio emission at 325 MHz. This image is in the J2000 coordinate system, north is up and east is to the left. X-ray and radio data are from this work whereas optical and lensing data are from Bradač et al. (2008). The scale bar denotes the angular extent corresponding to a physical distance of 0.5 Mpc at the redshift of MACS0025.
Current usage metrics show cumulative count of Article Views (full-text article views including HTML views, PDF and ePub downloads, according to the available data) and Abstracts Views on Vision4Press platform.
Data correspond to usage on the plateform after 2015. The current usage metrics is available 48-96 hours after online publication and is updated daily on week days.
Initial download of the metrics may take a while.