Free Access
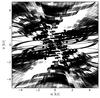
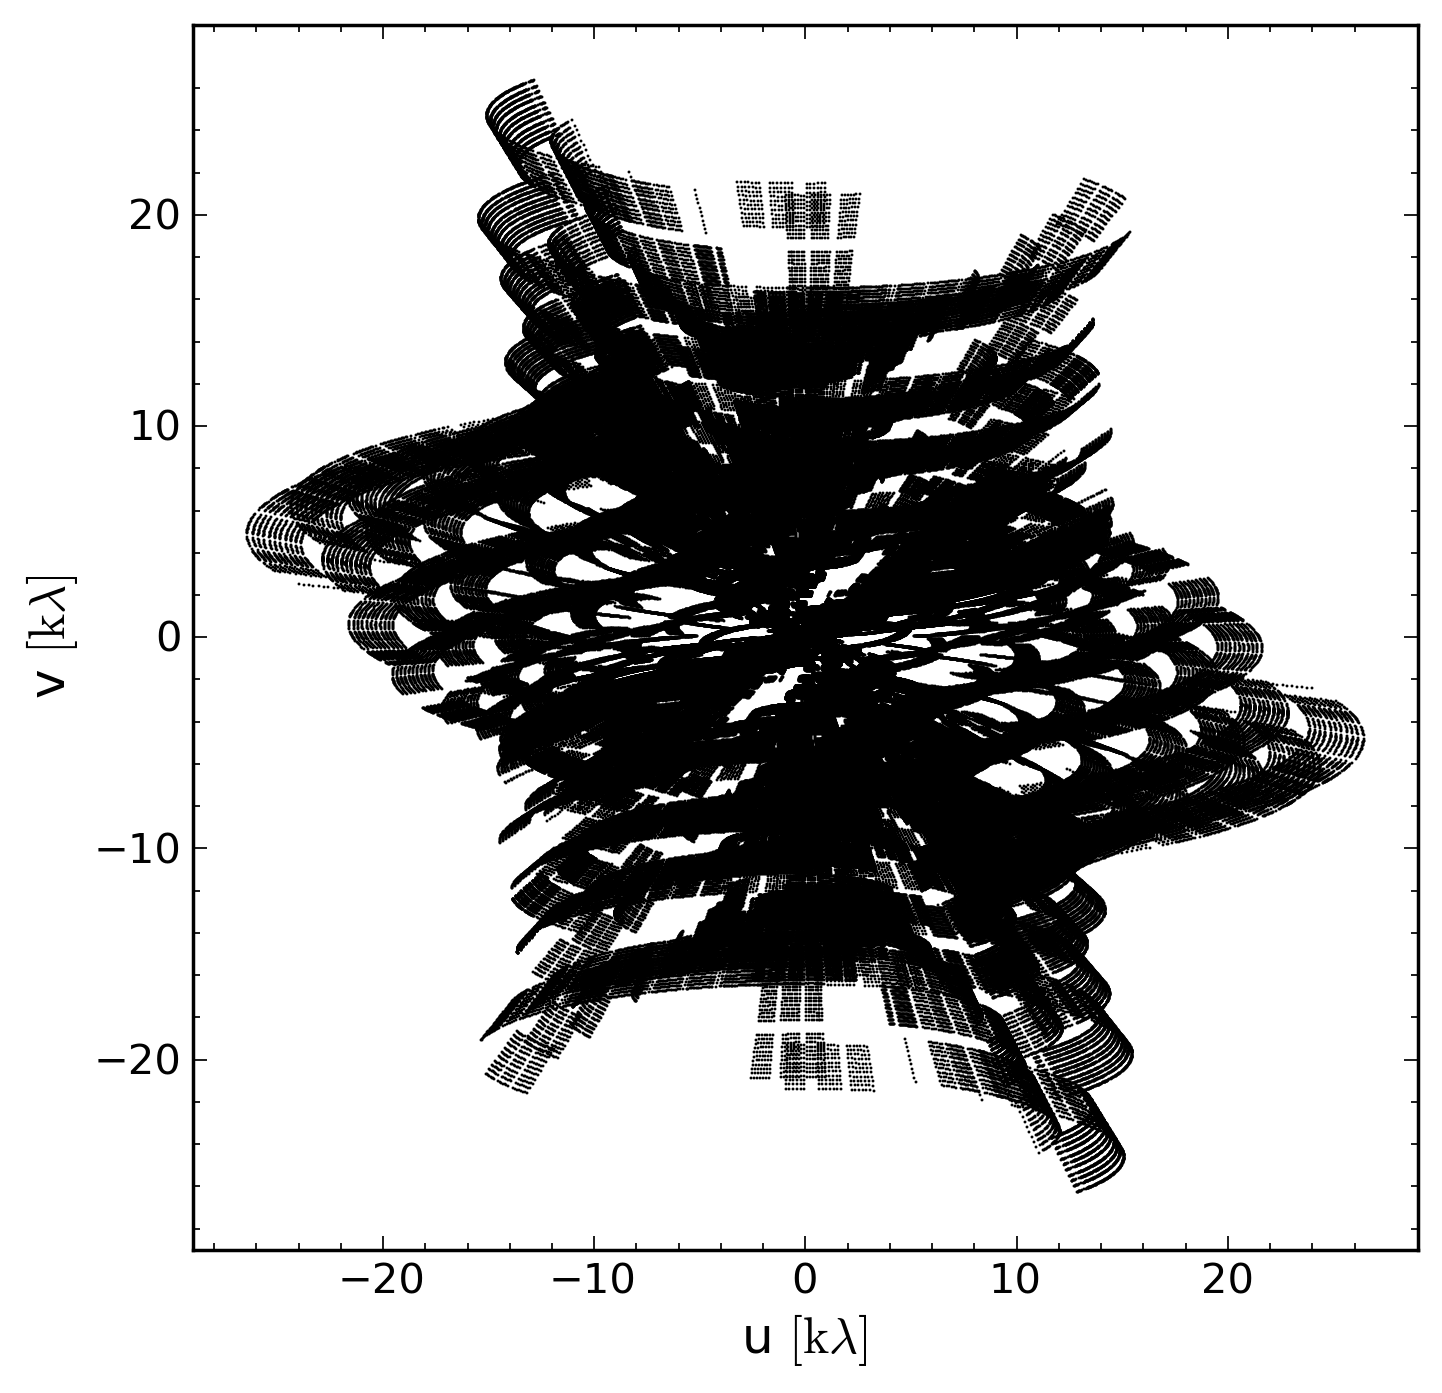
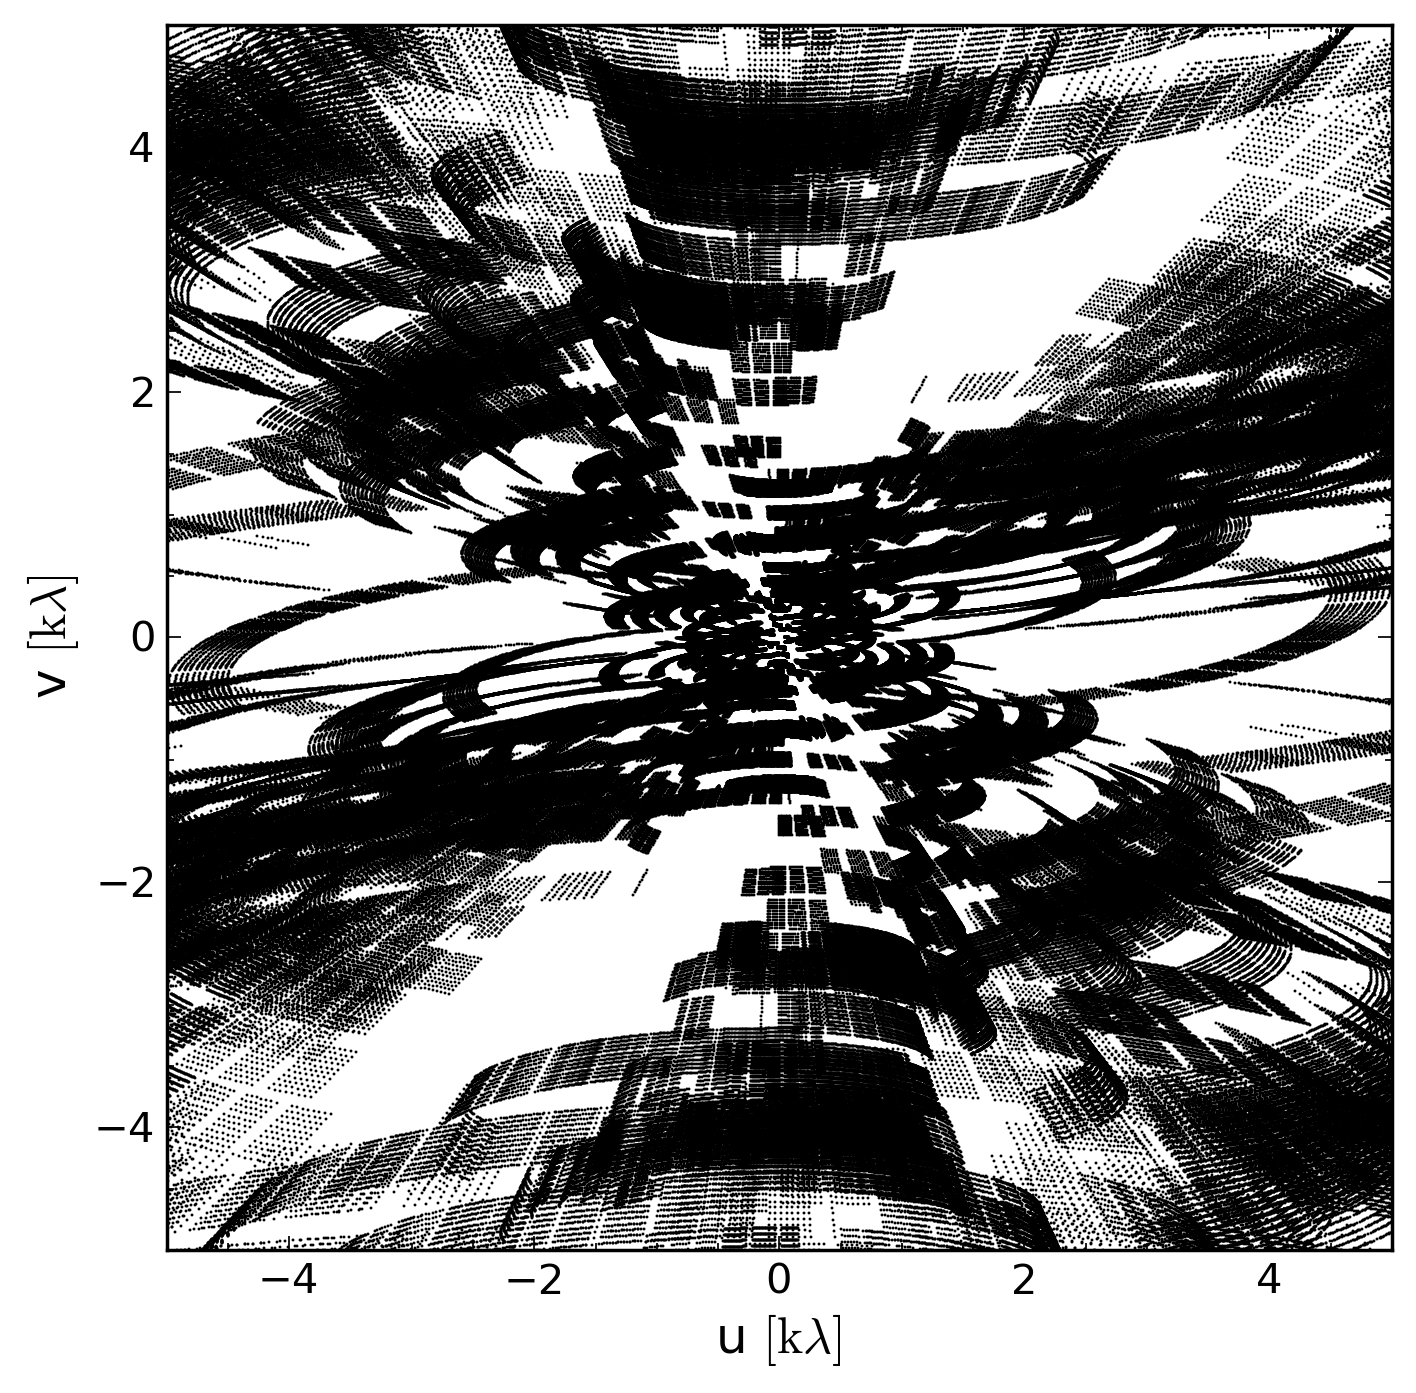
Fig. 1
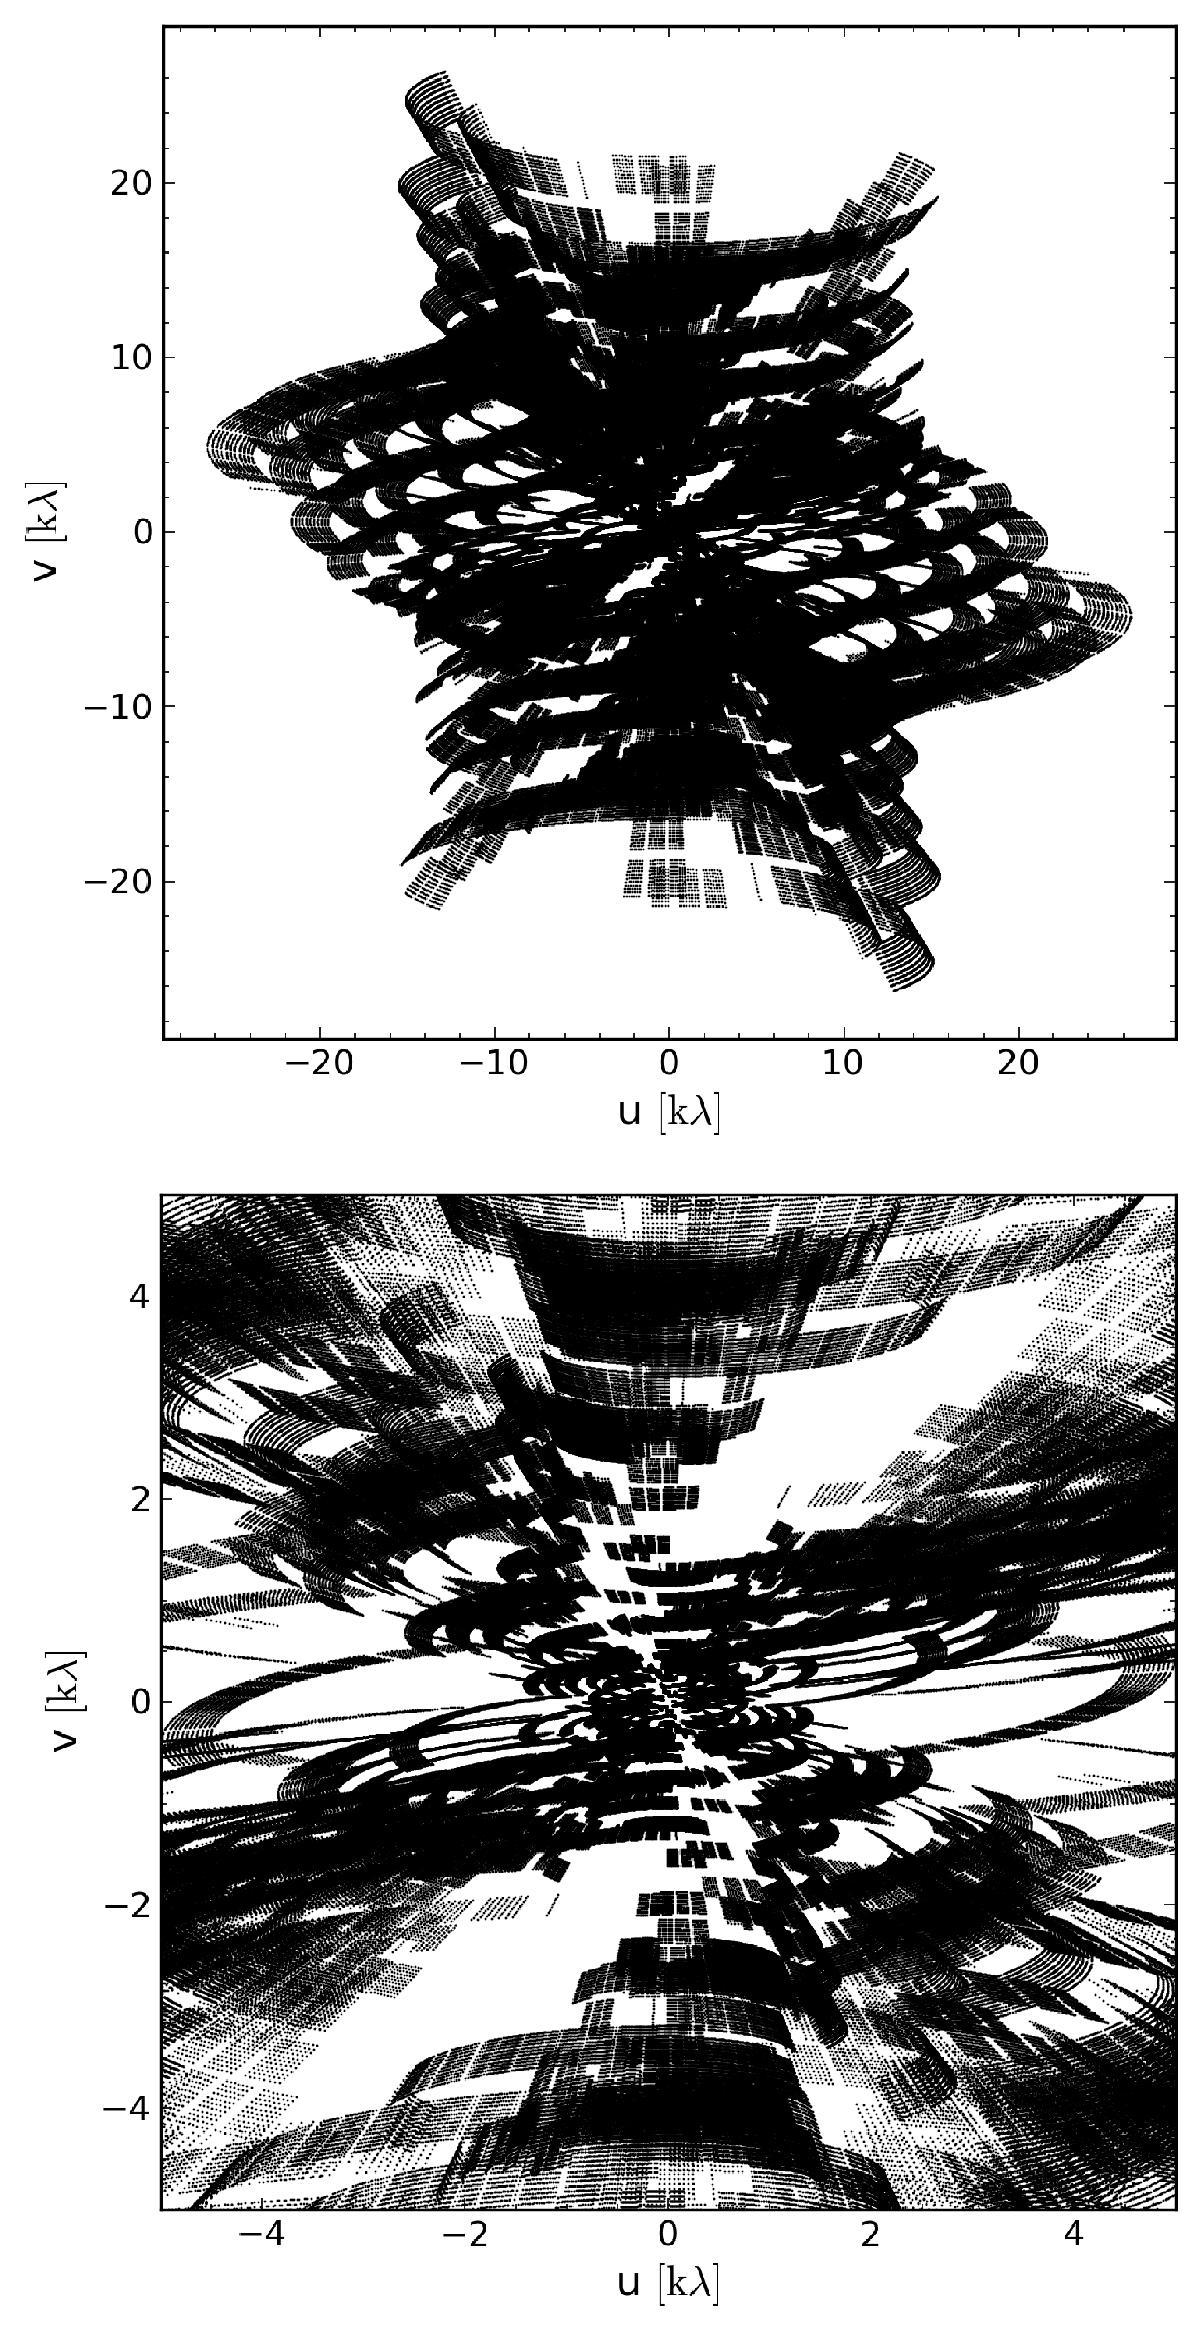
uv-coverage of GMRT observations of MACS0025. Top: full uv-range. Bottom: zoom on the central portion of the uv-plane, illustrating the coverage on short baselines. Only one out of every ten data points are plotted.
This figure is made of several images, please see below:

Current usage metrics show cumulative count of Article Views (full-text article views including HTML views, PDF and ePub downloads, according to the available data) and Abstracts Views on Vision4Press platform.
Data correspond to usage on the plateform after 2015. The current usage metrics is available 48-96 hours after online publication and is updated daily on week days.
Initial download of the metrics may take a while.