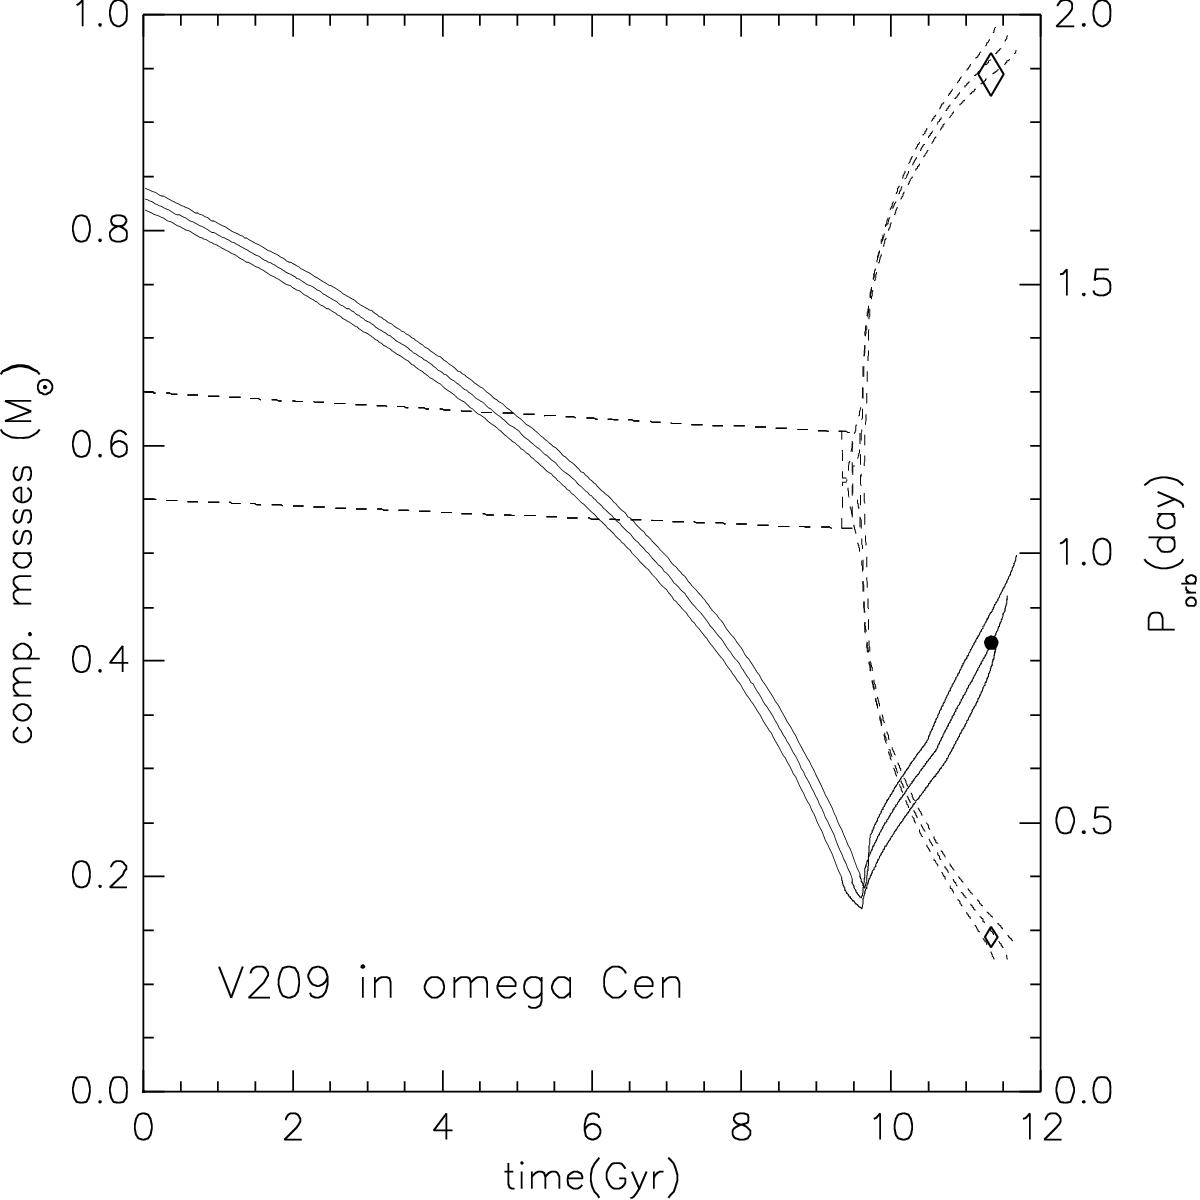
Fig. 5

Time variations of orbital period (solid lines, right axis) and component masses (broken lines, left axis) of the best fitting model of V209 (see Table 2 for its initial parameters). Also shown are two models with the same initial component masses, and periods differing by ±0.02 d from the best-fitting one. The observed parameters of V209 are indicated by a filled circle (period) and diamonds (masses). Vertical sizes of the diamonds correspond to observational errors.
Current usage metrics show cumulative count of Article Views (full-text article views including HTML views, PDF and ePub downloads, according to the available data) and Abstracts Views on Vision4Press platform.
Data correspond to usage on the plateform after 2015. The current usage metrics is available 48-96 hours after online publication and is updated daily on week days.
Initial download of the metrics may take a while.


