Fig. A.2
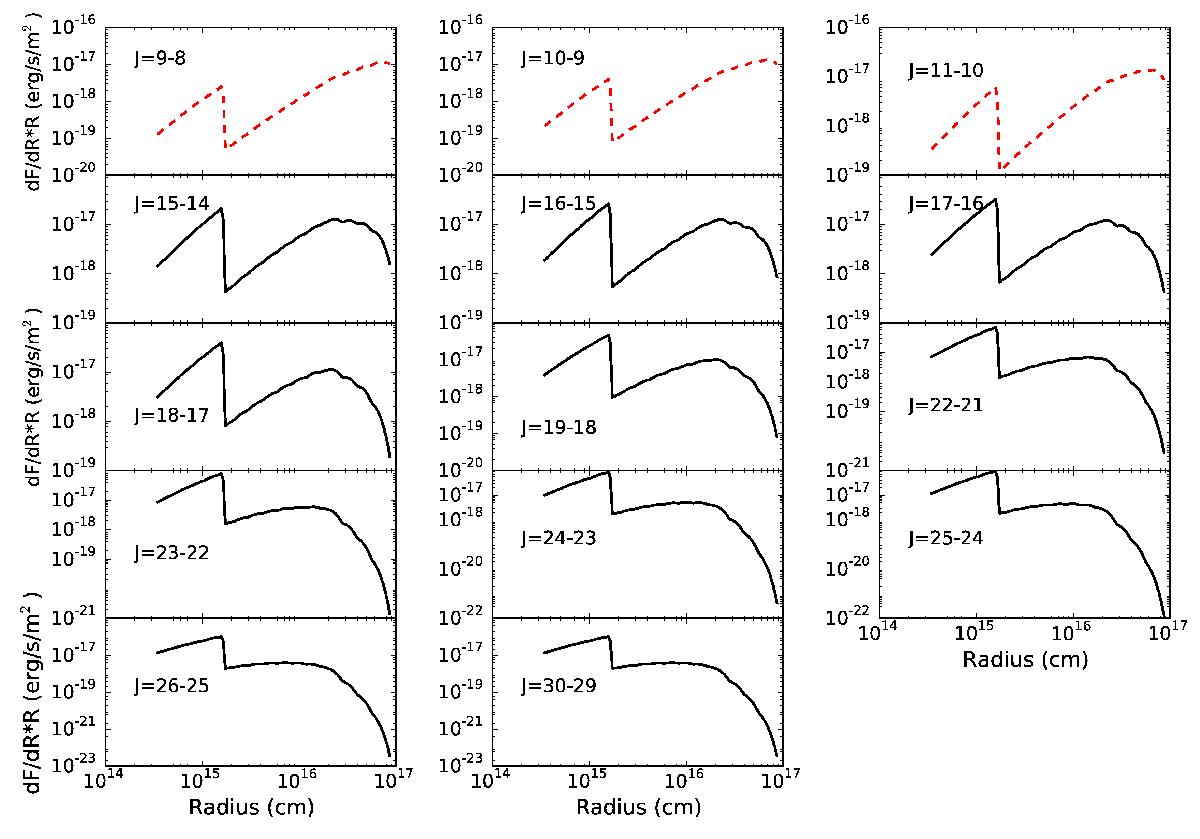
Predicted contribution to the integrated line intensity (dF/ dr ∗ r) of a shell at a radius r for the HC3N lines. This model corresponds to α = 0, Tjump = 80 K, Xin = 3.6 × 10⁻¹⁰, and Xout = 6.0 × 10⁻¹¹. The three upper red dashed curves show an increasing emission towards the maximum radius and very likely contaminated by the molecular cloud (see Sect. 4.2.1).
Current usage metrics show cumulative count of Article Views (full-text article views including HTML views, PDF and ePub downloads, according to the available data) and Abstracts Views on Vision4Press platform.
Data correspond to usage on the plateform after 2015. The current usage metrics is available 48-96 hours after online publication and is updated daily on week days.
Initial download of the metrics may take a while.