Fig. 9
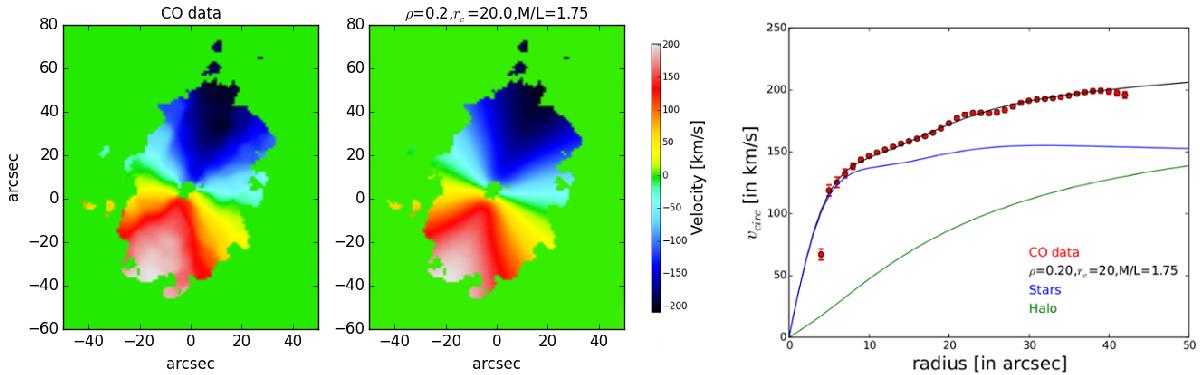
Comparison between the CO observations and our convolved two-dimensional velocity model. The left and middle panels show the CO data obtained by Wong et al. (2004) and our model which best describes the CO data. The right panel shows the rotation curves of the CO observations (red points) and the best-fitting model (black solid line). We also separately plot the rotation curves from the stellar (blue solid line) and dark matter (green solid line) potential. All model curves are convolved with the kernel by Qian et al. (1995).
Current usage metrics show cumulative count of Article Views (full-text article views including HTML views, PDF and ePub downloads, according to the available data) and Abstracts Views on Vision4Press platform.
Data correspond to usage on the plateform after 2015. The current usage metrics is available 48-96 hours after online publication and is updated daily on week days.
Initial download of the metrics may take a while.