Fig. 7
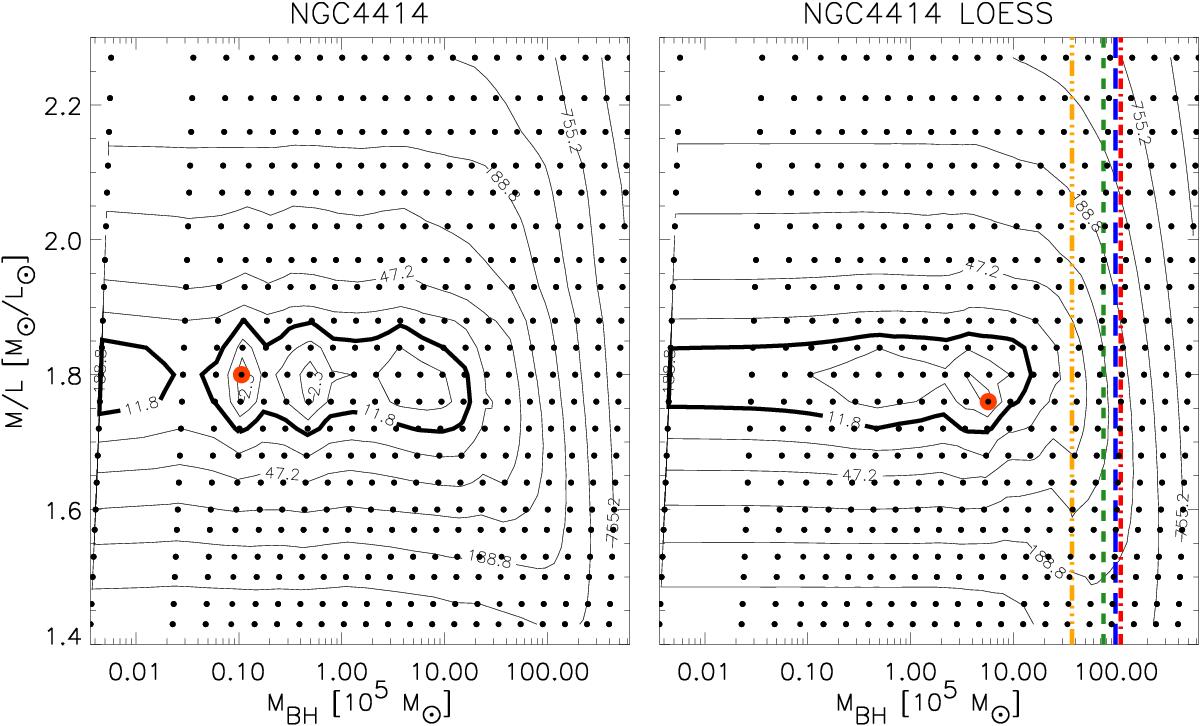
Grids of Schwarzschild dynamical models (round symbols) with different mass-to-light ratios and black hole masses. Contours are the ![]() levels. The thick contours are the 3σ levels. Both panels are for regularization parameter of Δ = 10, while the right hand panel shows smoothed Δχ2 contours using the local non-parametric regression LOESS algorithm (Cleveland 1979; Cappellari et al. 2013b), with the local polynomial set to quadratic. The large red circle shows the model with the formal χ2 minimum. The LOESS smoothed χ2 contours indicate that no χ2 minimum is reached within our grid when models are marginalized over all M/L ratios. The dashed (green) line indicates the values of MBH for which the sphere of influence is three times smaller than the resolution of our NIFS data (this value is also close to the prediction based on the McConnell & Ma (2013)MBH−σe scaling relation). The dashed-double dotted (orange), long-dashed (blue) and dashed-dotted (red) vertical lines indicate predictions for MBH of the van den Bosch (2016), Saglia et al. (2016) and Greene et al. (2016) scaling relation (for all galaxies in their samples), respectively.
levels. The thick contours are the 3σ levels. Both panels are for regularization parameter of Δ = 10, while the right hand panel shows smoothed Δχ2 contours using the local non-parametric regression LOESS algorithm (Cleveland 1979; Cappellari et al. 2013b), with the local polynomial set to quadratic. The large red circle shows the model with the formal χ2 minimum. The LOESS smoothed χ2 contours indicate that no χ2 minimum is reached within our grid when models are marginalized over all M/L ratios. The dashed (green) line indicates the values of MBH for which the sphere of influence is three times smaller than the resolution of our NIFS data (this value is also close to the prediction based on the McConnell & Ma (2013)MBH−σe scaling relation). The dashed-double dotted (orange), long-dashed (blue) and dashed-dotted (red) vertical lines indicate predictions for MBH of the van den Bosch (2016), Saglia et al. (2016) and Greene et al. (2016) scaling relation (for all galaxies in their samples), respectively.
Current usage metrics show cumulative count of Article Views (full-text article views including HTML views, PDF and ePub downloads, according to the available data) and Abstracts Views on Vision4Press platform.
Data correspond to usage on the plateform after 2015. The current usage metrics is available 48-96 hours after online publication and is updated daily on week days.
Initial download of the metrics may take a while.