Fig. 6
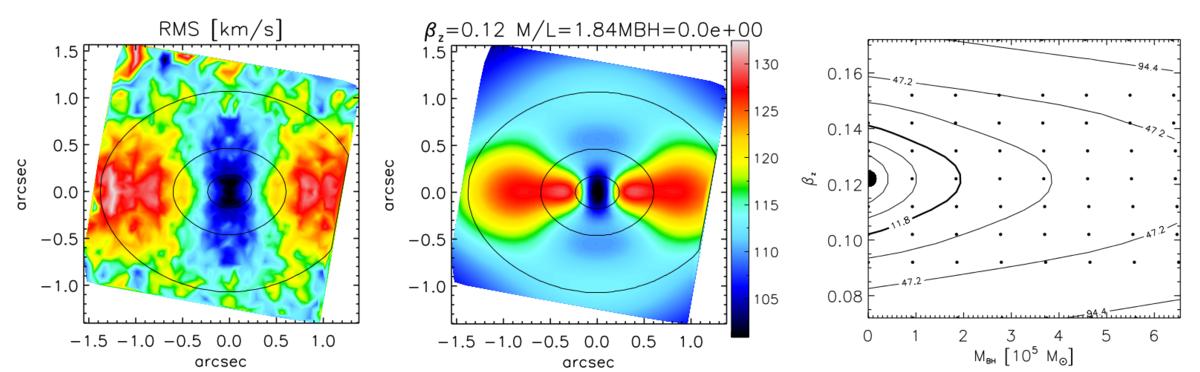
Results of the JAM modeling method. The left panel shows the bi-symmetrized ![]() observed with NIFS. The middle panel shows the JAM model for the upper limit of the mass of the central SMBH MBH = 0 M⊙ and the best fitting anisotropy parameter β = 0.12. It is clearly visible that the model cannot reproduce the NIFS VRMS very well. The right panel shows the grid of computed models (black points) overplotted with smoothed Δχ2 contour lines to find the best fitting model (larger black dot). The smoothing was applied by a minimum curvature algorithm. The thick contour line denotes the 3σ threshold.
observed with NIFS. The middle panel shows the JAM model for the upper limit of the mass of the central SMBH MBH = 0 M⊙ and the best fitting anisotropy parameter β = 0.12. It is clearly visible that the model cannot reproduce the NIFS VRMS very well. The right panel shows the grid of computed models (black points) overplotted with smoothed Δχ2 contour lines to find the best fitting model (larger black dot). The smoothing was applied by a minimum curvature algorithm. The thick contour line denotes the 3σ threshold.
Current usage metrics show cumulative count of Article Views (full-text article views including HTML views, PDF and ePub downloads, according to the available data) and Abstracts Views on Vision4Press platform.
Data correspond to usage on the plateform after 2015. The current usage metrics is available 48-96 hours after online publication and is updated daily on week days.
Initial download of the metrics may take a while.