Fig. B.1
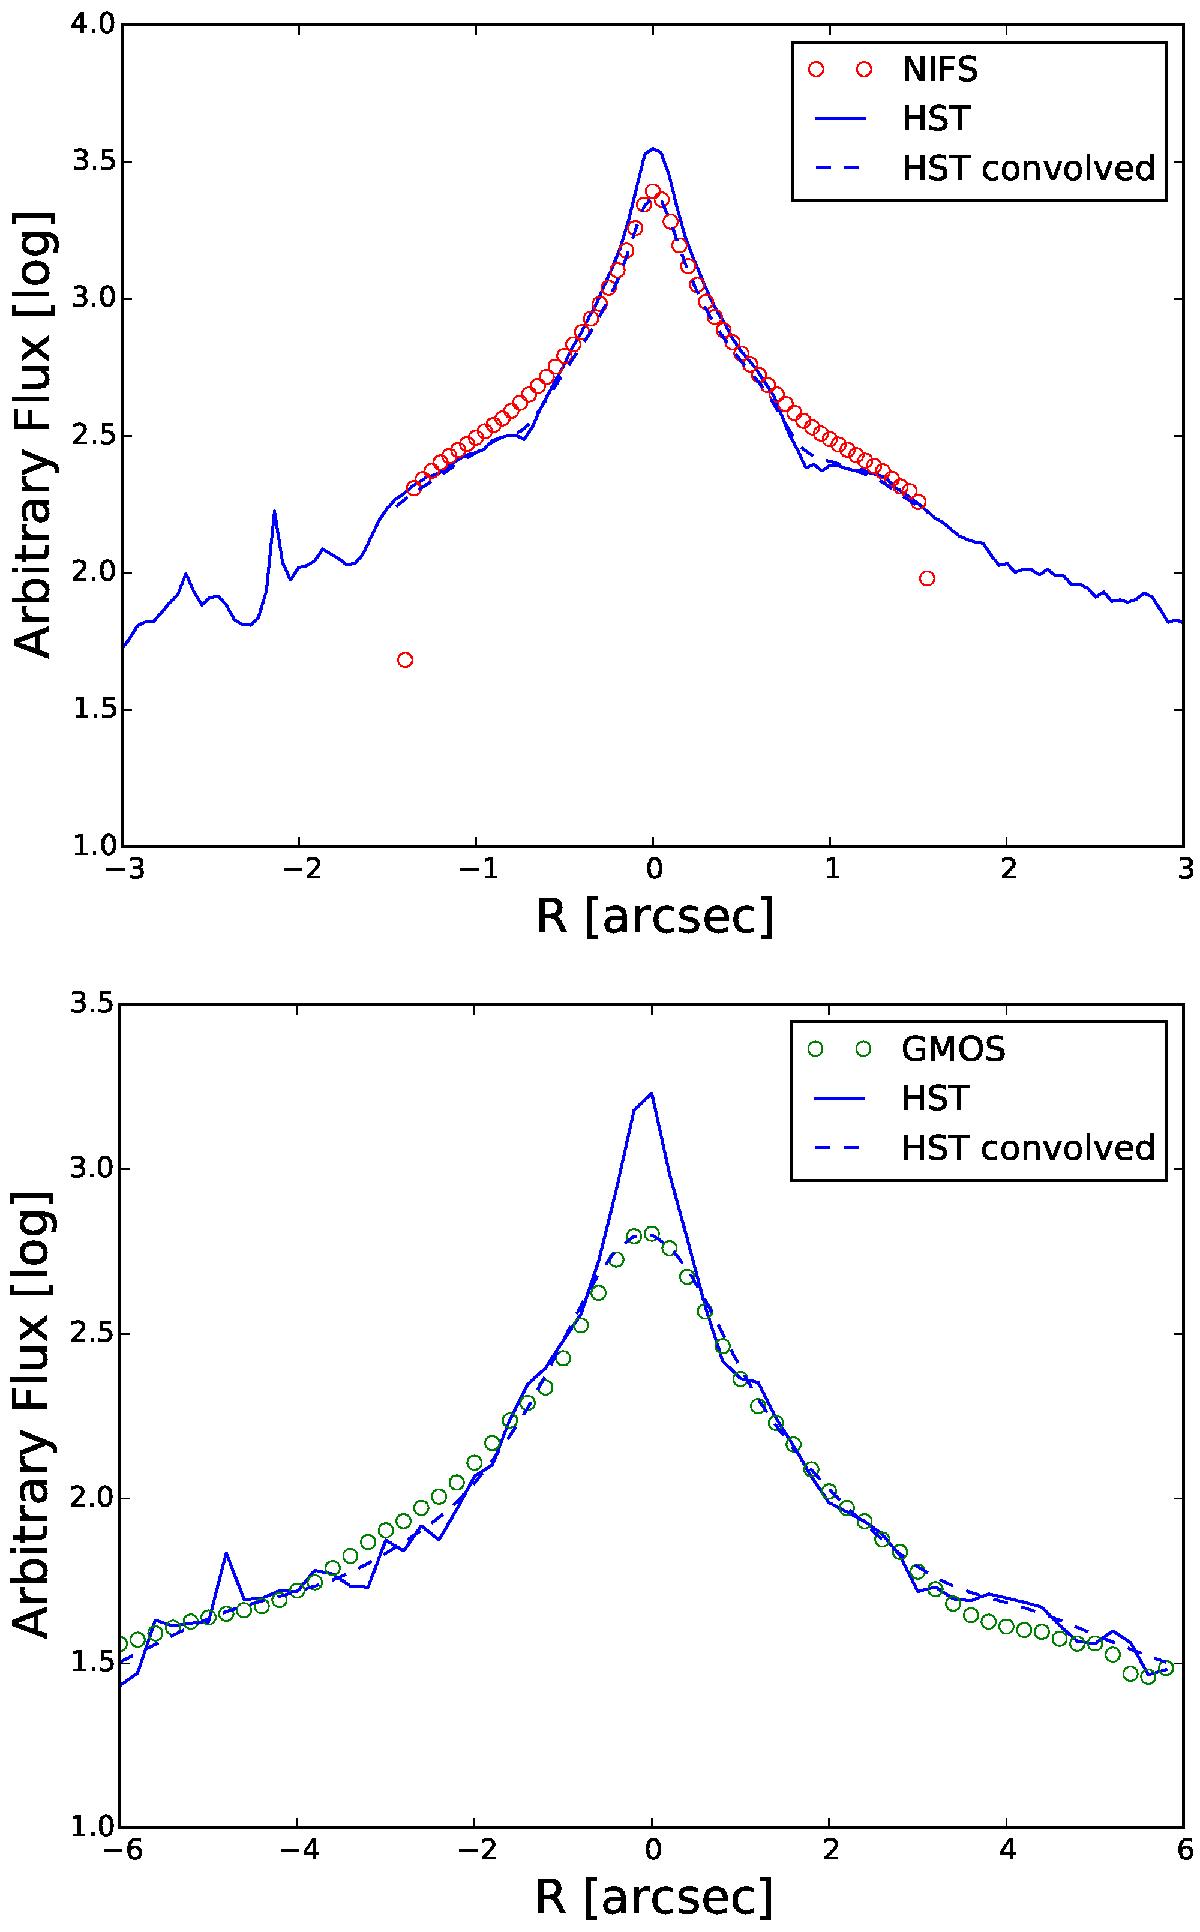
Determination of the NIFS (top) and GMOS (bottom) PSF by comparing the light profiles of the NIFS/GMOS and HST images along the major axis. In both panels the open circles denote the IFU profiles and blue solid lines the HST profiles. The HST profiles were convolved with the PSFs of Table 2 to fit the IFU data and are shown as dashed blue lines.
Current usage metrics show cumulative count of Article Views (full-text article views including HTML views, PDF and ePub downloads, according to the available data) and Abstracts Views on Vision4Press platform.
Data correspond to usage on the plateform after 2015. The current usage metrics is available 48-96 hours after online publication and is updated daily on week days.
Initial download of the metrics may take a while.