Fig. A.2
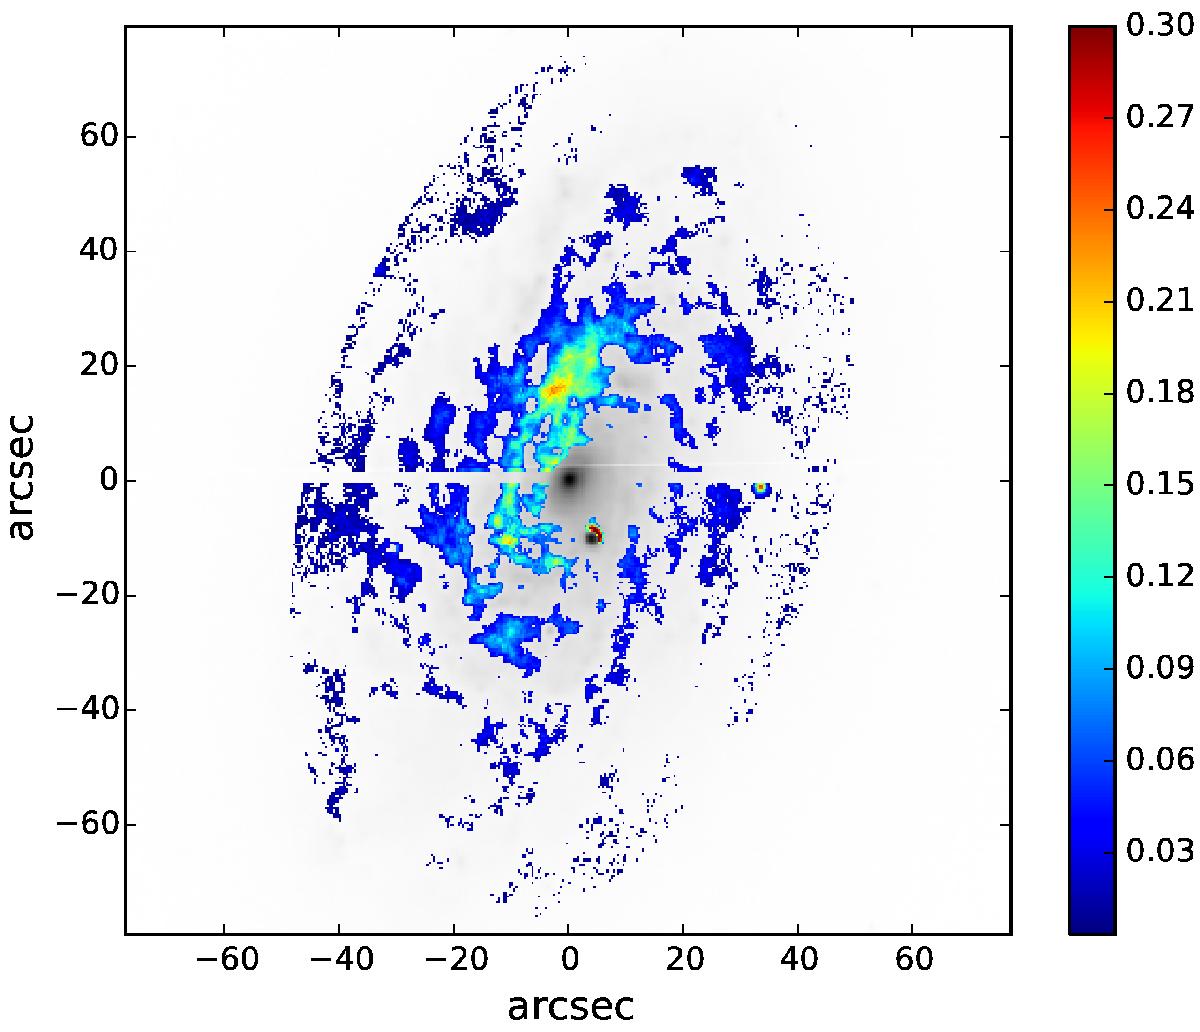
Dust-corrected central region of the observed SDSS r-band image. The correction was only applied within a major axis radius of 80″ (see caption of Fig. A.1). The over-plotted color coding indicates the degree of the correction where 0.1 means that the observed flux increased by 10%. The lines in the center of the image are edge artifacts from assembling the single SDSS images to a large FOV montage.
Current usage metrics show cumulative count of Article Views (full-text article views including HTML views, PDF and ePub downloads, according to the available data) and Abstracts Views on Vision4Press platform.
Data correspond to usage on the plateform after 2015. The current usage metrics is available 48-96 hours after online publication and is updated daily on week days.
Initial download of the metrics may take a while.