Fig. A.1
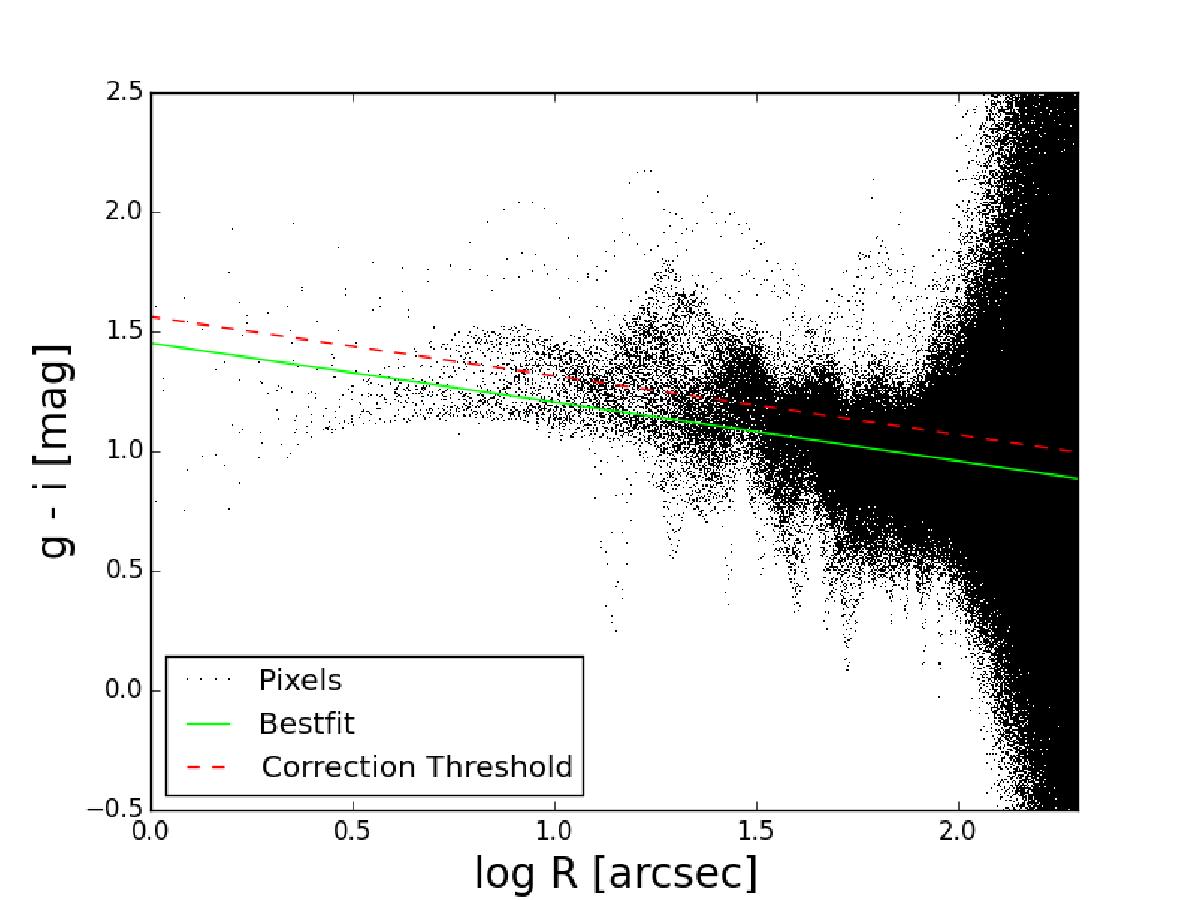
Color profile of the SDSS g−i map used for the dust correction. The best-fitting linear line obtained by a robust fit is shown in green. We decided the red line to be the threshold in order to assure the same width of the gradient under the line-fit and above. All pixels above the red line and for log (d) < 1.9 ( ≈ 80) [arcsec] were corrected for extinction.
Current usage metrics show cumulative count of Article Views (full-text article views including HTML views, PDF and ePub downloads, according to the available data) and Abstracts Views on Vision4Press platform.
Data correspond to usage on the plateform after 2015. The current usage metrics is available 48-96 hours after online publication and is updated daily on week days.
Initial download of the metrics may take a while.