Fig. 9
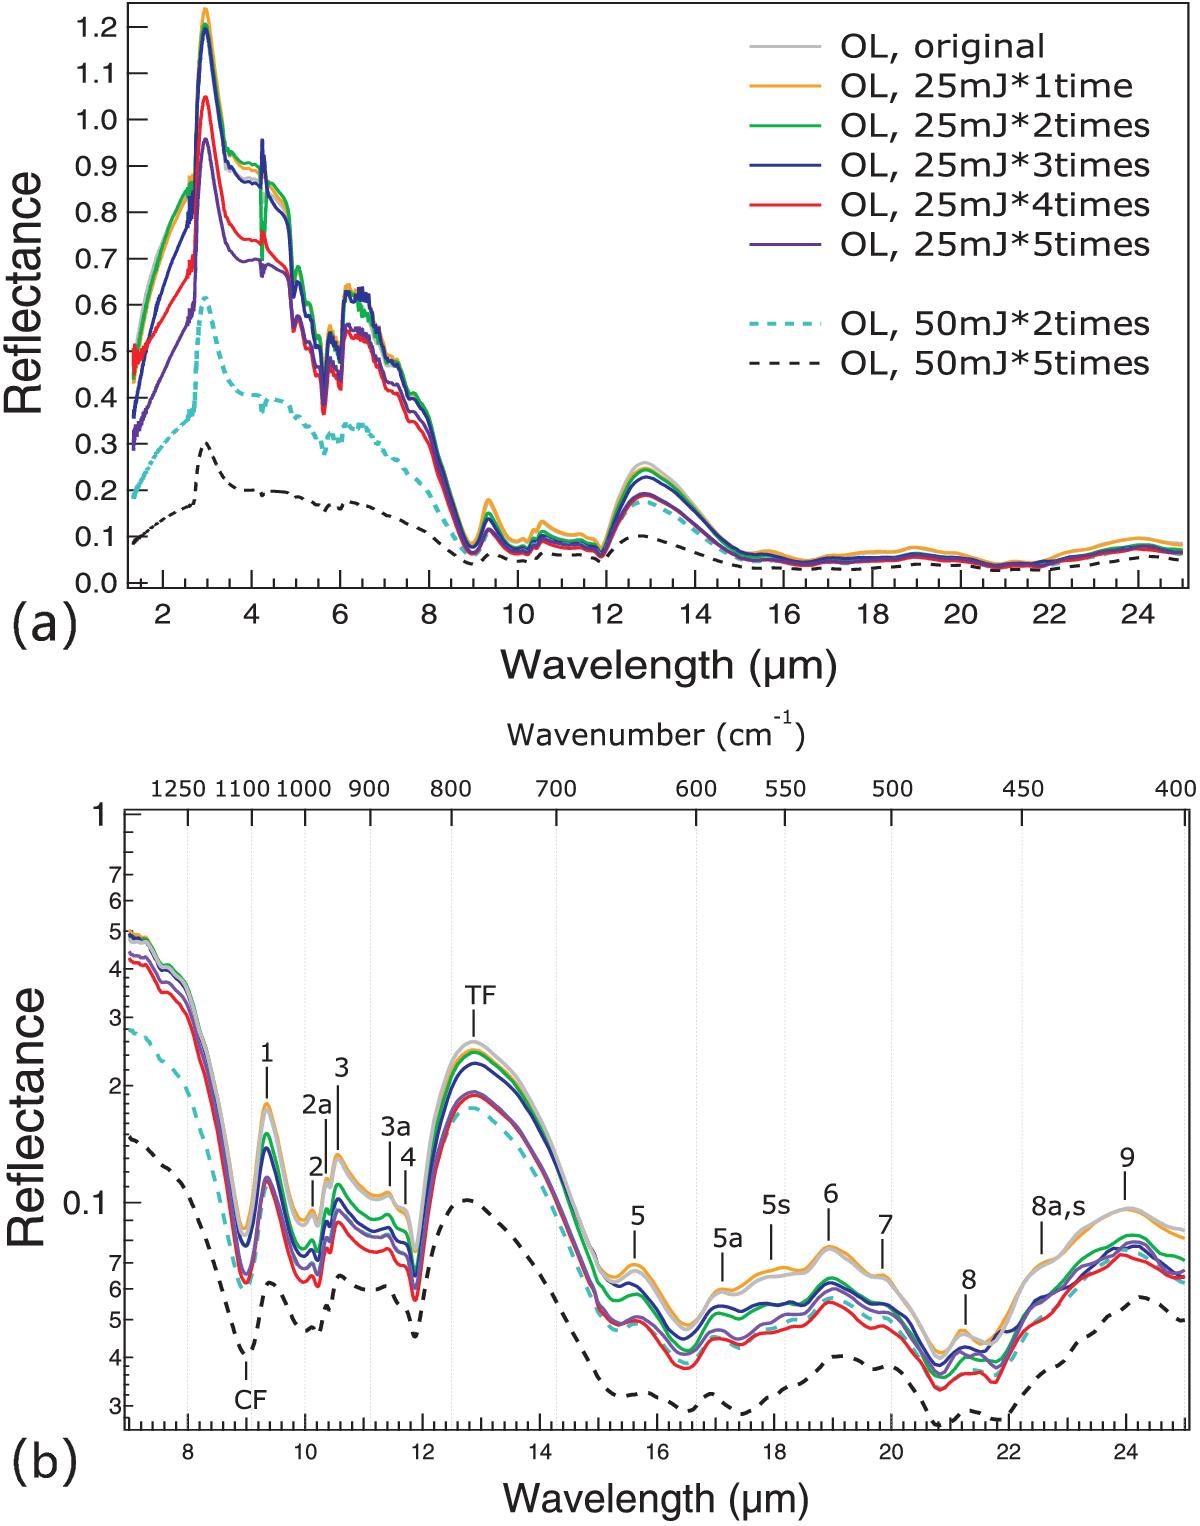
MIR reflectance spectra of olivine samples before and after irradiations in decimal scale a) and logarithmic scale b). The MIR spectra were measured relative to a gold mirror stardard and then scaled to the VNIR value in the overlapping region. CF: the Christiansen Feature; TF: the Transparency Feature. The numbers indicating the vibrational modes are summarized in Table 3 in Hamilton (2010).
Current usage metrics show cumulative count of Article Views (full-text article views including HTML views, PDF and ePub downloads, according to the available data) and Abstracts Views on Vision4Press platform.
Data correspond to usage on the plateform after 2015. The current usage metrics is available 48-96 hours after online publication and is updated daily on week days.
Initial download of the metrics may take a while.