Fig. 13
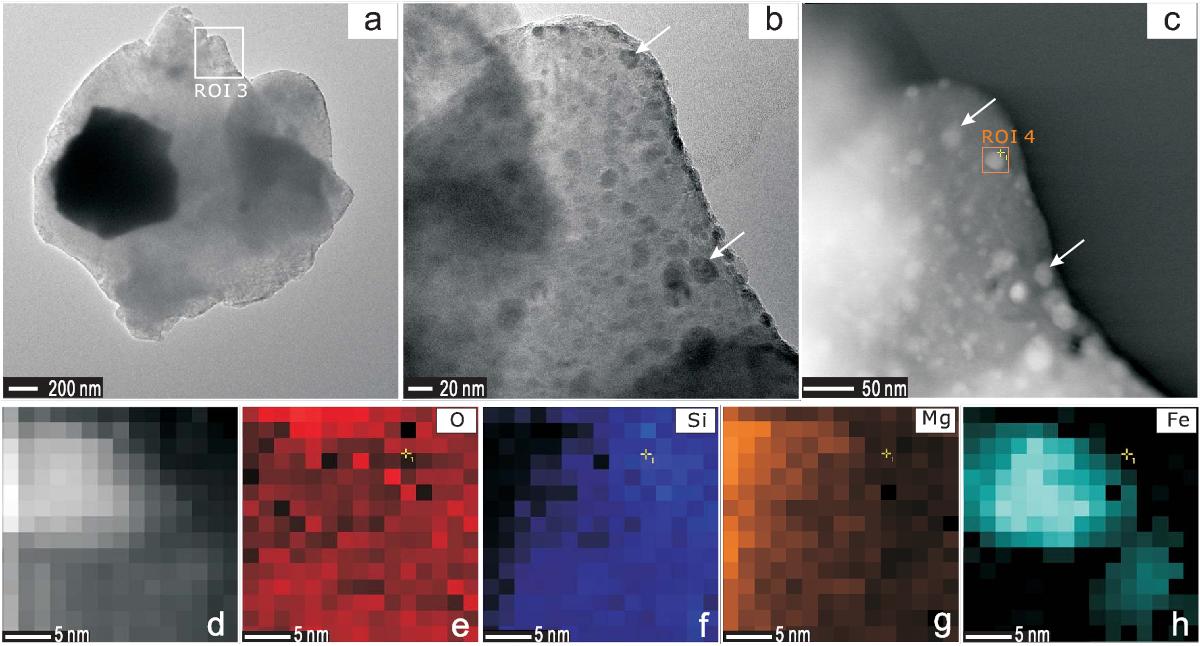
TEM image and EDS mapping results of the olivine sample irradiated under 50 mJ for 5 times. a) Bright field image of one olivine particle; b) the enlarged image of ROI 3 as indicated by the white box in a); c) the dark field image of ROI 3, and ROI 4 is the region selected for EDS mapping; d) the high resolution image of ROI 4; e)–h) EDS mapping results of four major elements: O, Si, Mg, and Fe.
Current usage metrics show cumulative count of Article Views (full-text article views including HTML views, PDF and ePub downloads, according to the available data) and Abstracts Views on Vision4Press platform.
Data correspond to usage on the plateform after 2015. The current usage metrics is available 48-96 hours after online publication and is updated daily on week days.
Initial download of the metrics may take a while.