Fig. 12
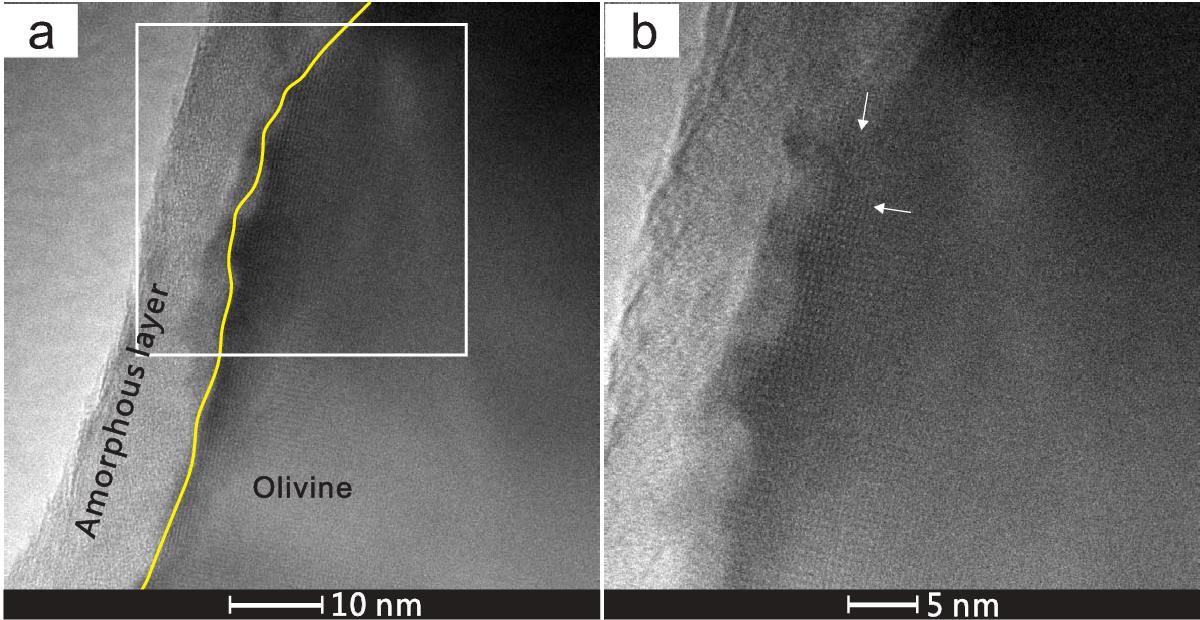
Typical bright field TEM images of the olivine sample after irradiation with 50 mJ/pulse for 2 times. a) A yellow curve indicating the boundary between the amorphous layer and the olivine crystal; b) the high resolution image of the enclosed area of the white box in a), showing the olivine lattice fringes indicated by the white arrows.
Current usage metrics show cumulative count of Article Views (full-text article views including HTML views, PDF and ePub downloads, according to the available data) and Abstracts Views on Vision4Press platform.
Data correspond to usage on the plateform after 2015. The current usage metrics is available 48-96 hours after online publication and is updated daily on week days.
Initial download of the metrics may take a while.