Fig. 11
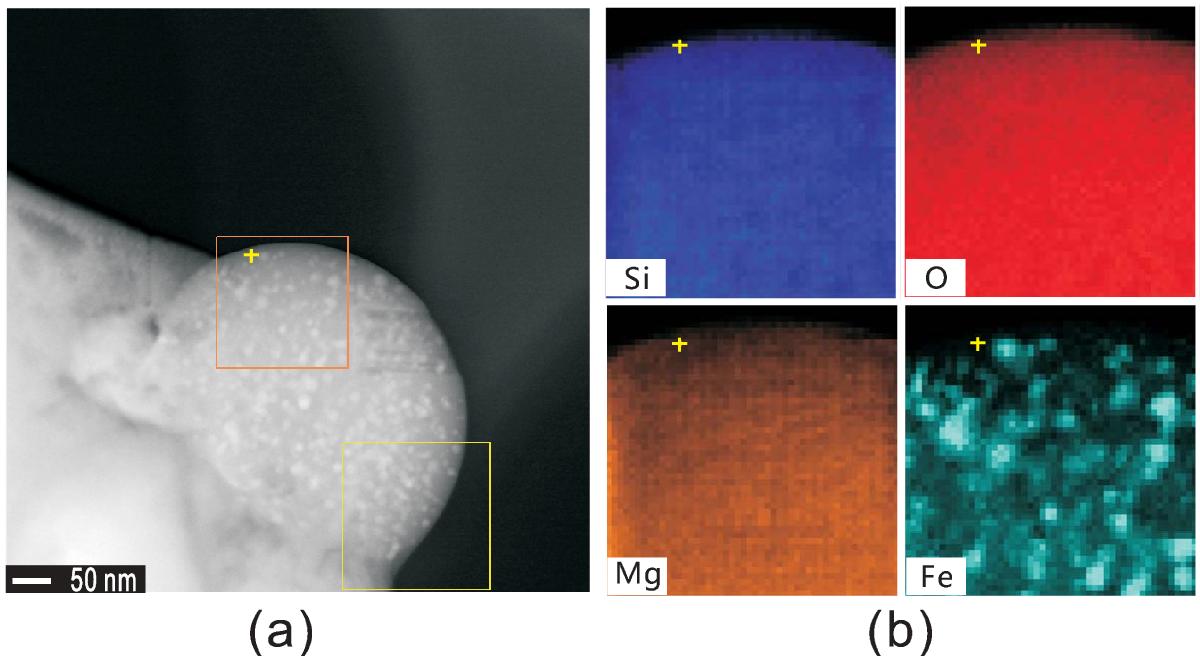
EDS mapping of major elements Si, O, Mg and Fe. a) Dark field image of the ROI 1 in Fig. 10a with the orange box indicating the EDS mapping region. The area surrounded by the yellow box is used for drift corrections; b) EDS mapping results of Si, O, Mg and Fe. The brightness of the pixels is correlated with the relative abundance of the corresponding element. The brighter spots in the Fe distribution map are consistent with the white spots in the enclosed area of the orange box, showing taht the nanoparticles are indeed nanophase irons.
Current usage metrics show cumulative count of Article Views (full-text article views including HTML views, PDF and ePub downloads, according to the available data) and Abstracts Views on Vision4Press platform.
Data correspond to usage on the plateform after 2015. The current usage metrics is available 48-96 hours after online publication and is updated daily on week days.
Initial download of the metrics may take a while.