Fig. 5
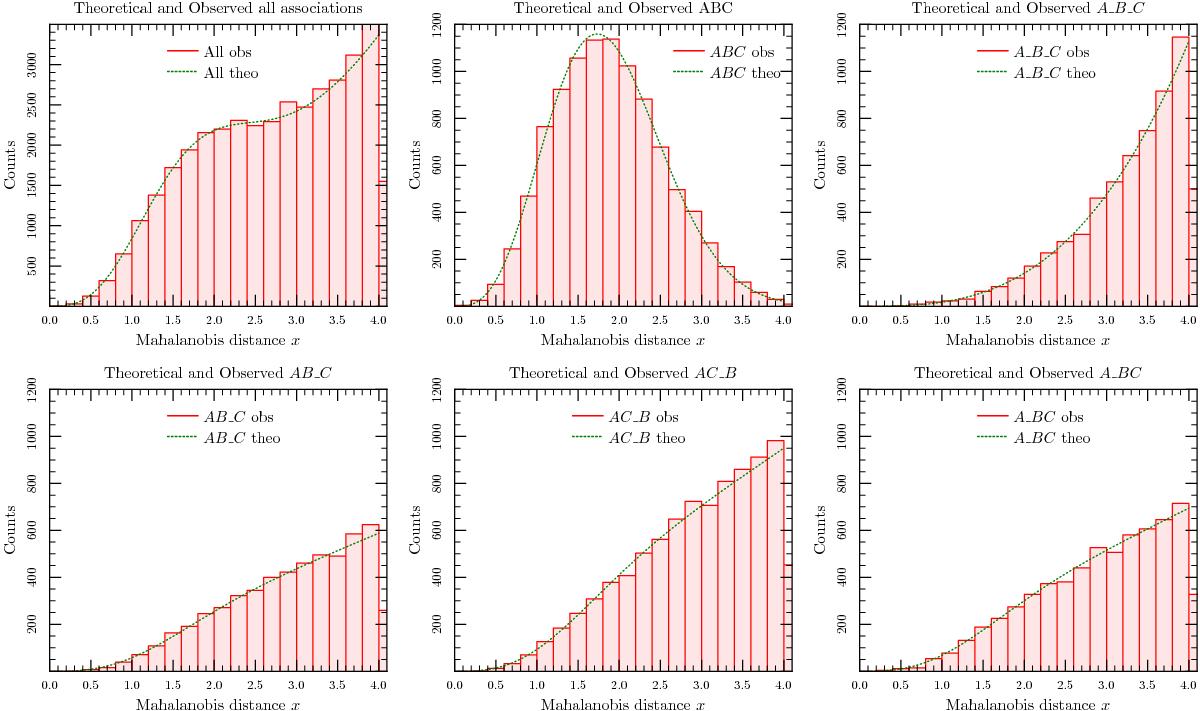
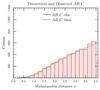
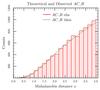
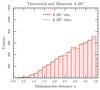
Result of the cross-match of three synthetic catalogues with input values nA = 40 000, nB = 20 000nC = 35 000nAB = 6000, nAC = 12 000, nBC = 18 000 and nABC = 10 000. The error on catalogue A is a constant equal to 0.4′′. The circular error on catalogue B follows a linear distribution between 0.8 and 1.2′′. The circular error on catalogue C follows a Gaussian distribution of mean 0.75′′ and standard deviation of 0.1′′ between 0.5 and 1′′. The common surface area is a cone of radius 0.42°. Top left: histogram of all associations and theoretical curve from the input parameters. Top centre: histogram of real associations and theoretical curve from input parameters. Top right: histogram of “fully” spurious associations and theoretical curve from input paramameters. Bottom: histograms and theoretical curves of associations mixing a real association between two sources plus a spurious source.
Current usage metrics show cumulative count of Article Views (full-text article views including HTML views, PDF and ePub downloads, according to the available data) and Abstracts Views on Vision4Press platform.
Data correspond to usage on the plateform after 2015. The current usage metrics is available 48-96 hours after online publication and is updated daily on week days.
Initial download of the metrics may take a while.