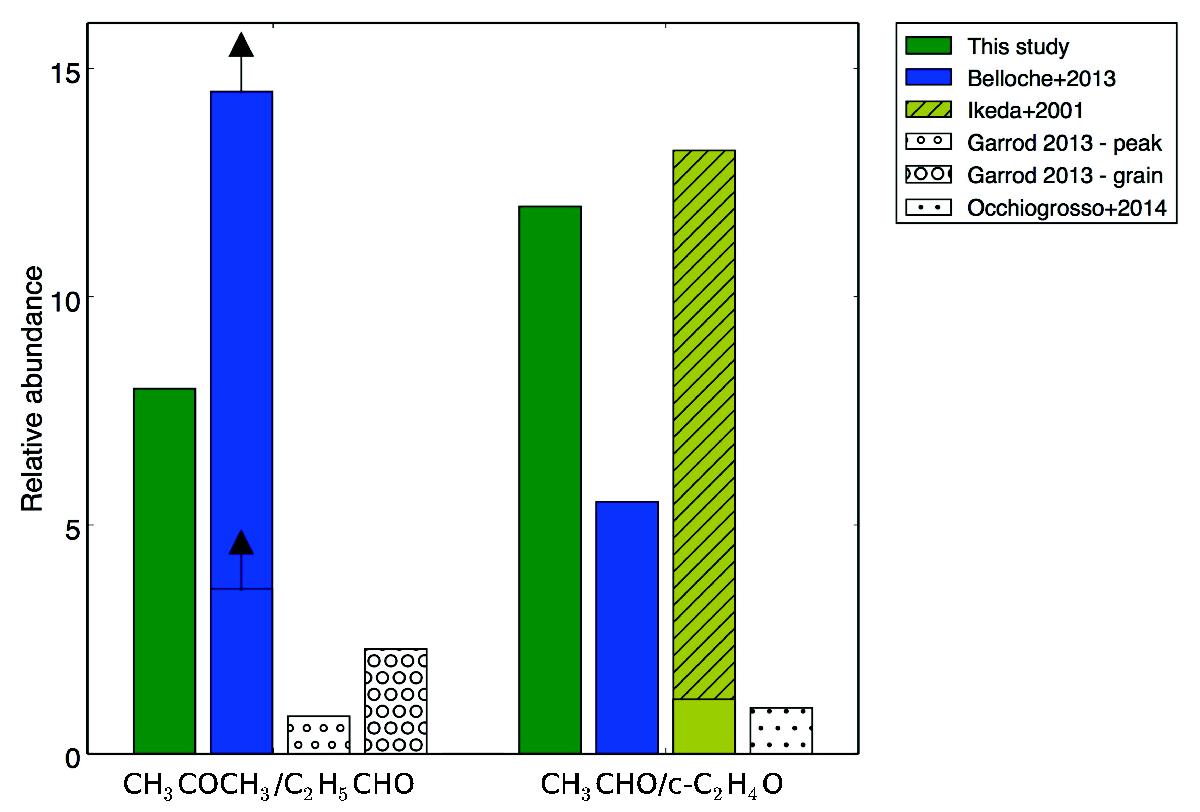
Fig. 3

Bar plot of the relative abundances of CH3COCH3/ C2H5CHO and CH3CHO/c-C2H4O from Table 1. The observations are indicated by color bars, while the chemical predictions are shown by white bars with different circle sizes. The two lower limits derived by Belloche et al. (2013) for CH3COCH3/C2H5CHO are illustrated by upward arrows. The range of CH3CHO/ c-C2H4O ratios determined in ten sources by Ikeda et al. (2001) is indicated by the hatched area. For the CH3CHO/ c-C2H4O ratio from Belloche et al. (2013), we used the average value of the column densities of the rotational and first torsionally (vt = 1) excited states of acetaldehyde.
Current usage metrics show cumulative count of Article Views (full-text article views including HTML views, PDF and ePub downloads, according to the available data) and Abstracts Views on Vision4Press platform.
Data correspond to usage on the plateform after 2015. The current usage metrics is available 48-96 hours after online publication and is updated daily on week days.
Initial download of the metrics may take a while.


