Fig. 1
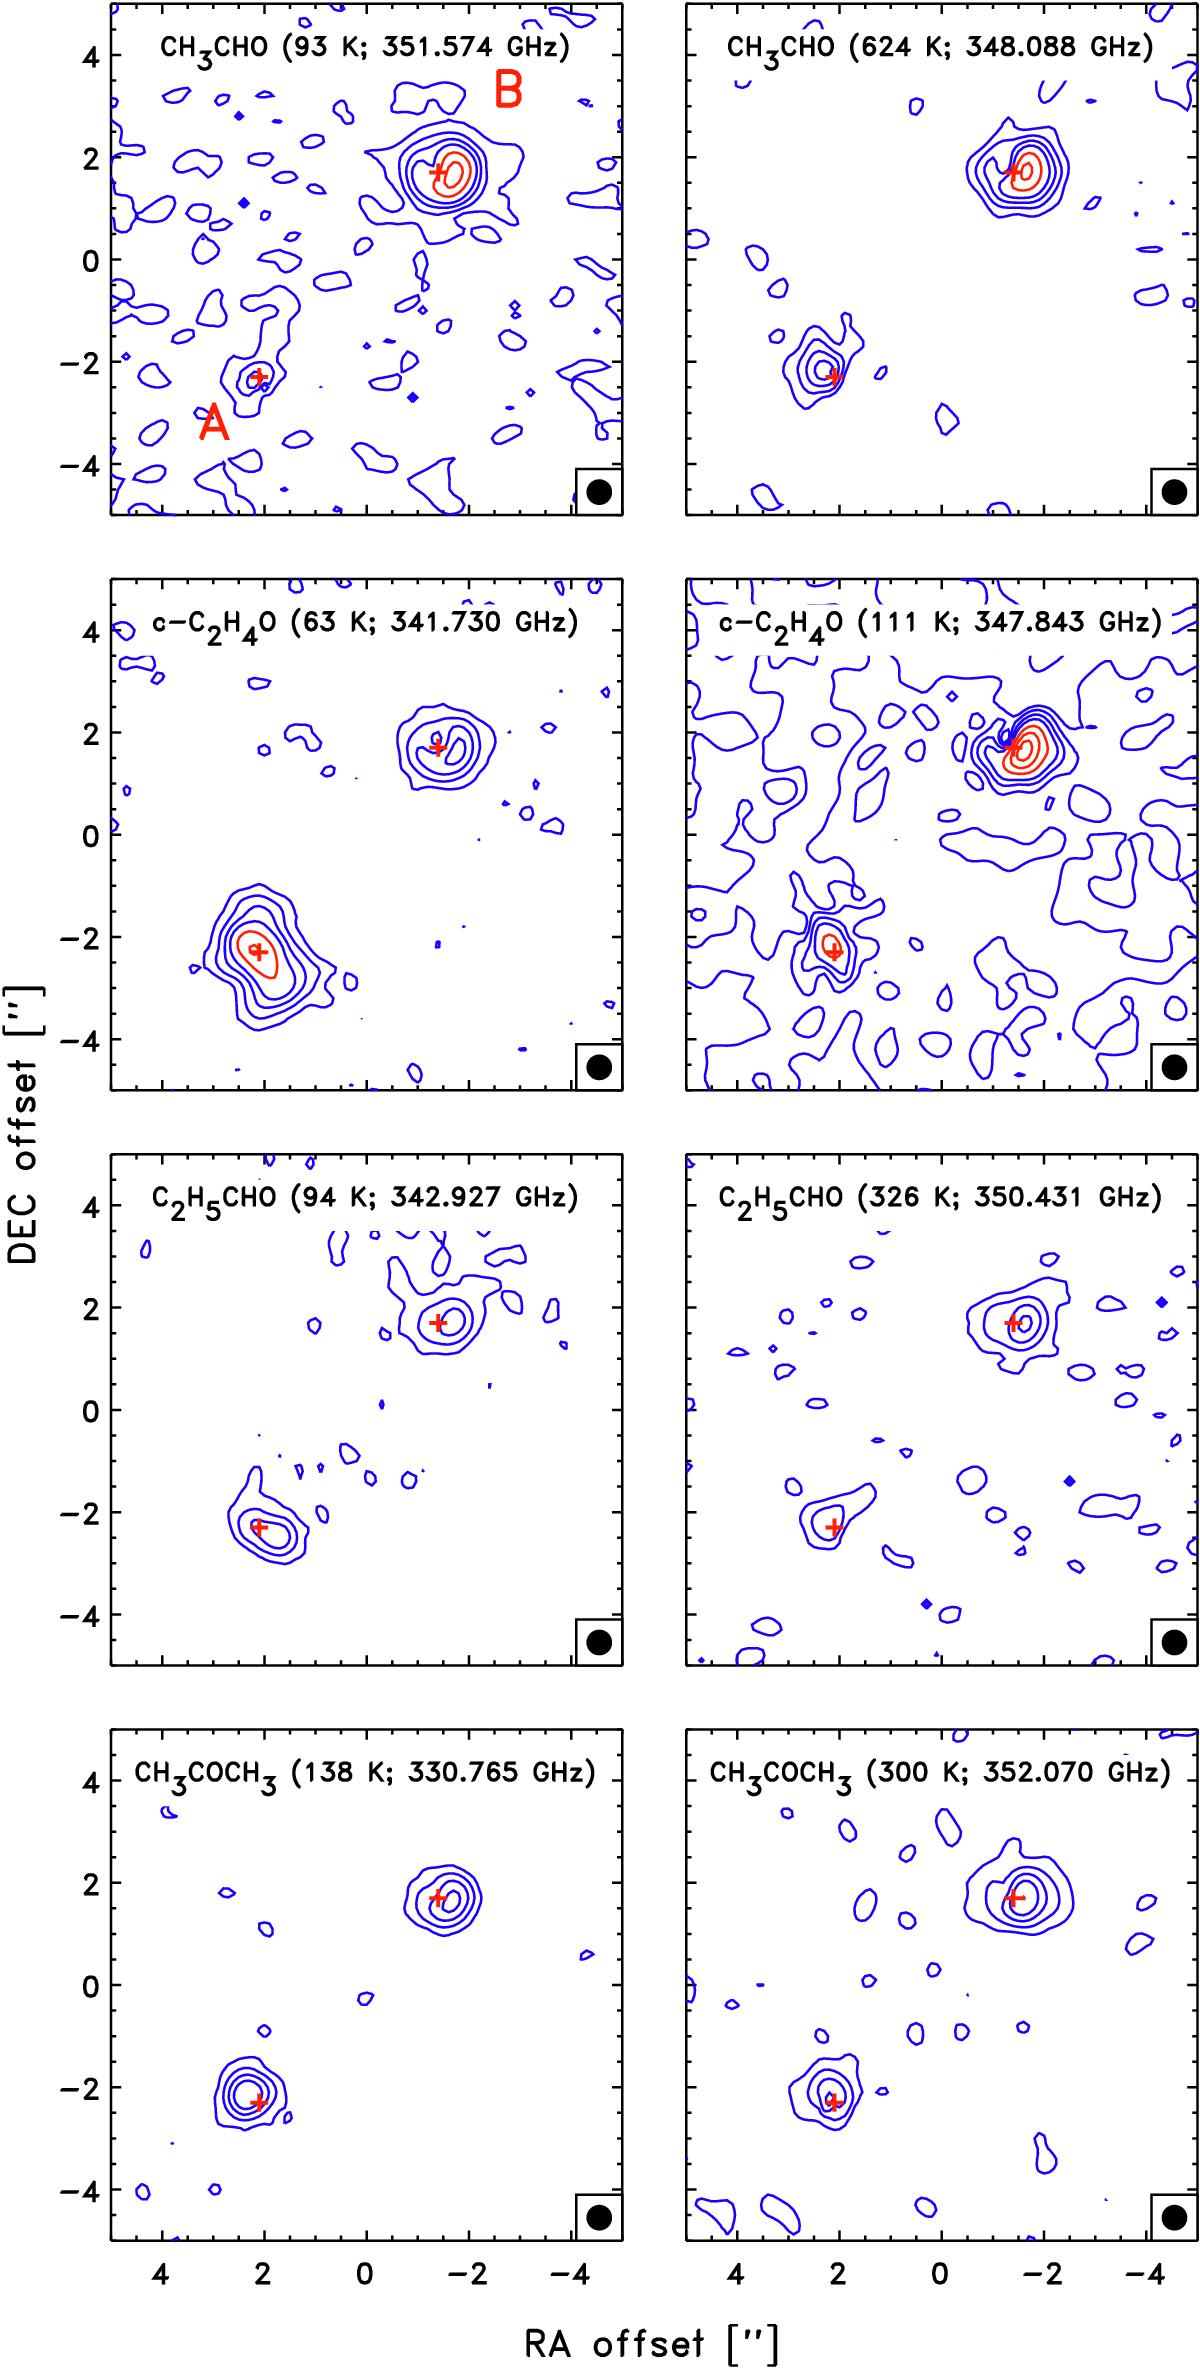
Integrated intensity maps of the line emission for acetaldehyde, ethylene oxide, acetone, and propanal. Left and right columns show maps for transitions with lower and higher Eup, respectively. The locations of IRAS 16293A (southeast) and IRAS 16293B (northwest) are marked by the red plus-signs. The blue contours represent 4, 8, 12 and 16σ while the red contours show 24, 30, 36σ, where σ is 5 mJy beam-1 km s-1 for the integrated intensity. A representative beam of 0.5″ is shown in the lower right-hand corner of each panel.
Current usage metrics show cumulative count of Article Views (full-text article views including HTML views, PDF and ePub downloads, according to the available data) and Abstracts Views on Vision4Press platform.
Data correspond to usage on the plateform after 2015. The current usage metrics is available 48-96 hours after online publication and is updated daily on week days.
Initial download of the metrics may take a while.