Fig. 11
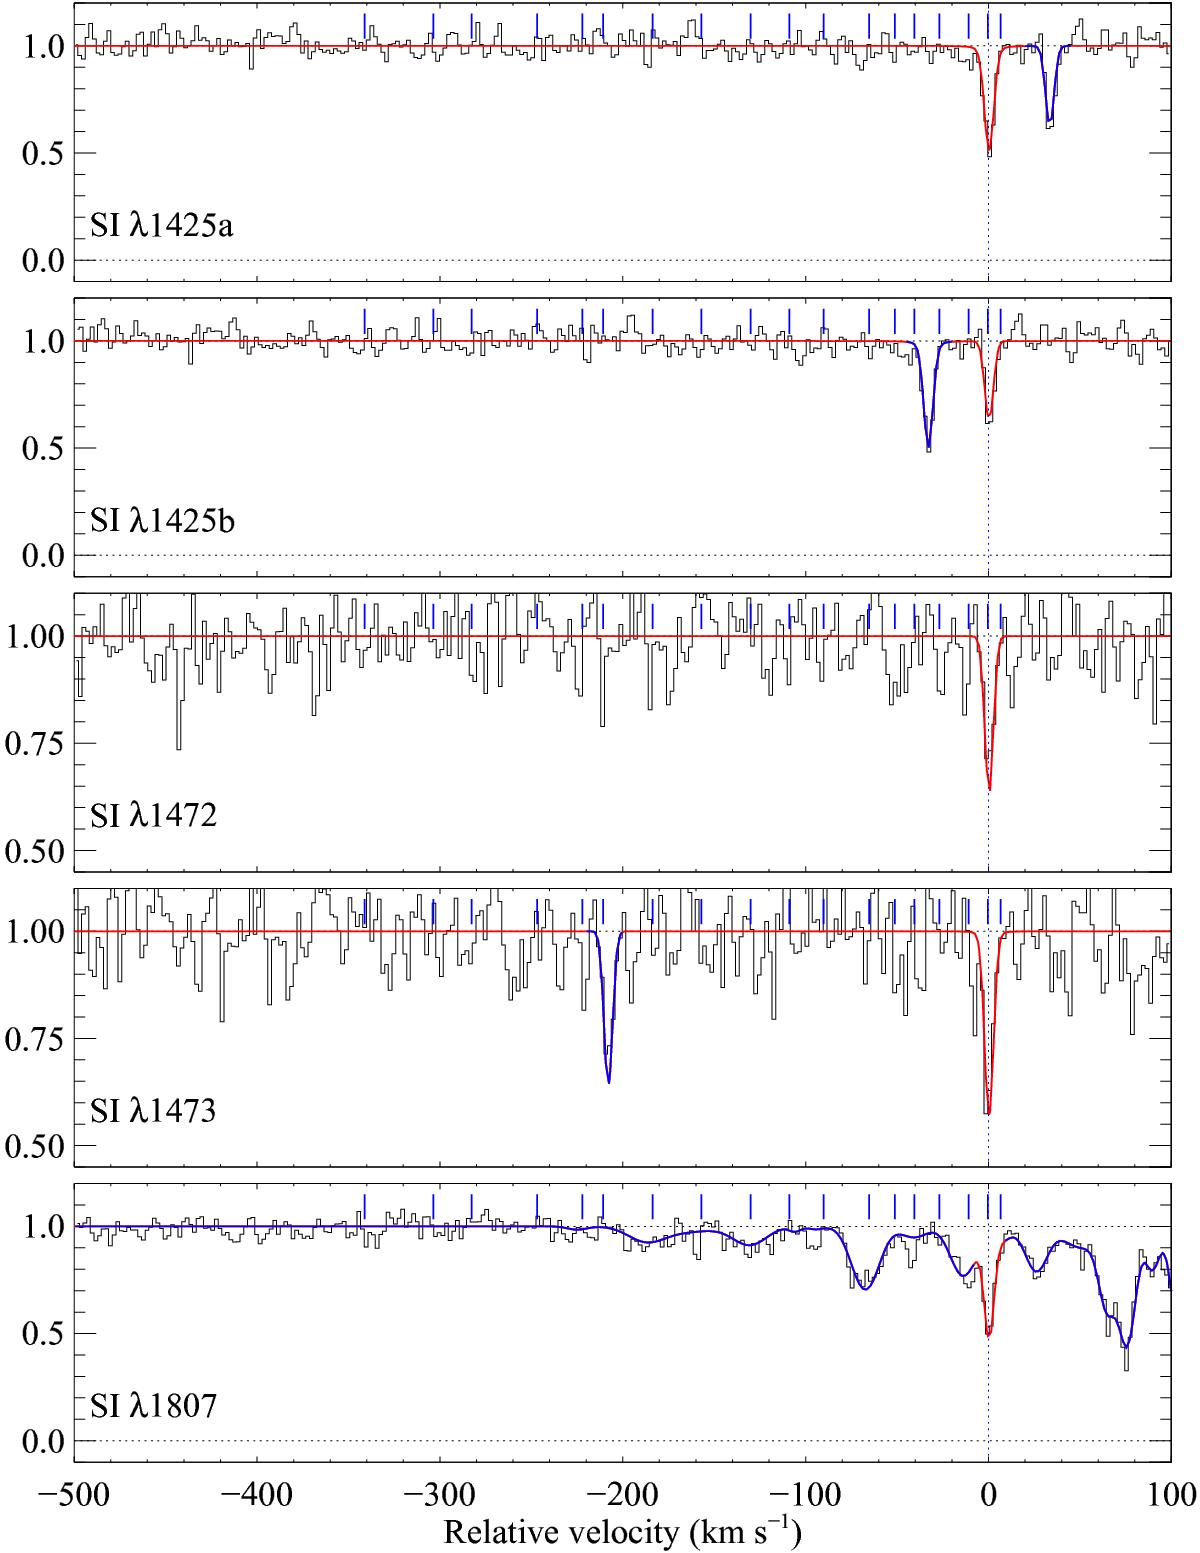
Neutral sulphur absorption lines (UVES data). As for Fig. 4, the continuous red line correspond to the best fit model, with regions corresponding to other absorption lines marked in blue (for example, most of the profile seen in the S iλ1807 actually corresponds to Si iiλ1808, except around v = 0km s-1). The short tick marks show the position of the singly ionised metal lines. We note that S i is detected only in the component that has CO.
Current usage metrics show cumulative count of Article Views (full-text article views including HTML views, PDF and ePub downloads, according to the available data) and Abstracts Views on Vision4Press platform.
Data correspond to usage on the plateform after 2015. The current usage metrics is available 48-96 hours after online publication and is updated daily on week days.
Initial download of the metrics may take a while.