Fig. 5
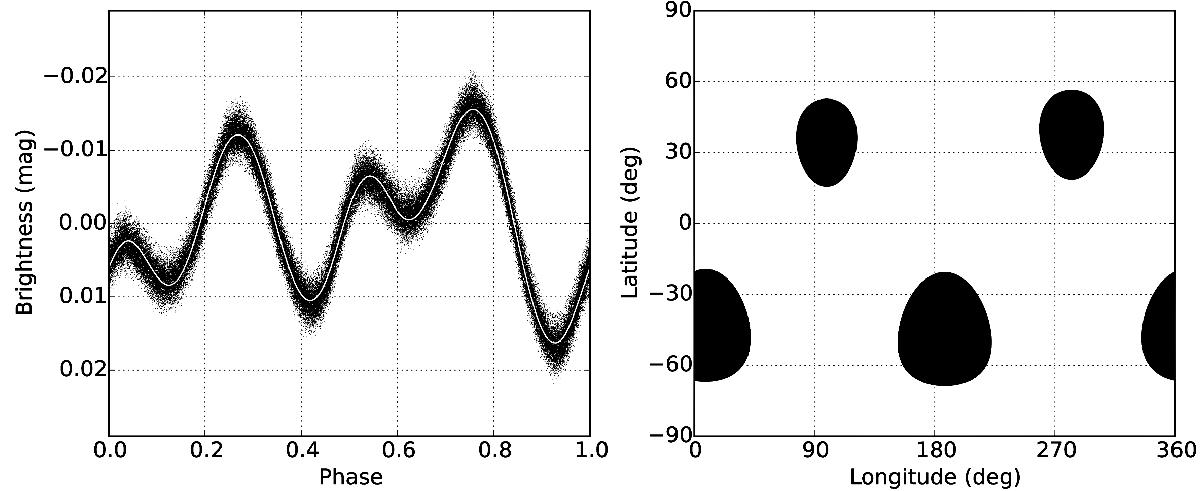
Four-spot light-curve fit. Left: phased CoRoT light curve (the white line is the SML fit and the small dots are the CoRoT data from Fig. 1). Right: spot model in Mercator representation (from left to right identified as spots 1, 2, 3, and 4, see Table 4). We note that the phases of the four light-curve minima do not coincide with the central longitudes of the four spots but that the recovered spot longitudes agree with a time of periastron passage at phase 0![]() 04 (≈14°) as a zero point plus an increment of ≈90° per spot. We also note that the spot solution is mathematically not unique.
04 (≈14°) as a zero point plus an increment of ≈90° per spot. We also note that the spot solution is mathematically not unique.
Current usage metrics show cumulative count of Article Views (full-text article views including HTML views, PDF and ePub downloads, according to the available data) and Abstracts Views on Vision4Press platform.
Data correspond to usage on the plateform after 2015. The current usage metrics is available 48-96 hours after online publication and is updated daily on week days.
Initial download of the metrics may take a while.