Free Access
Fig. 3
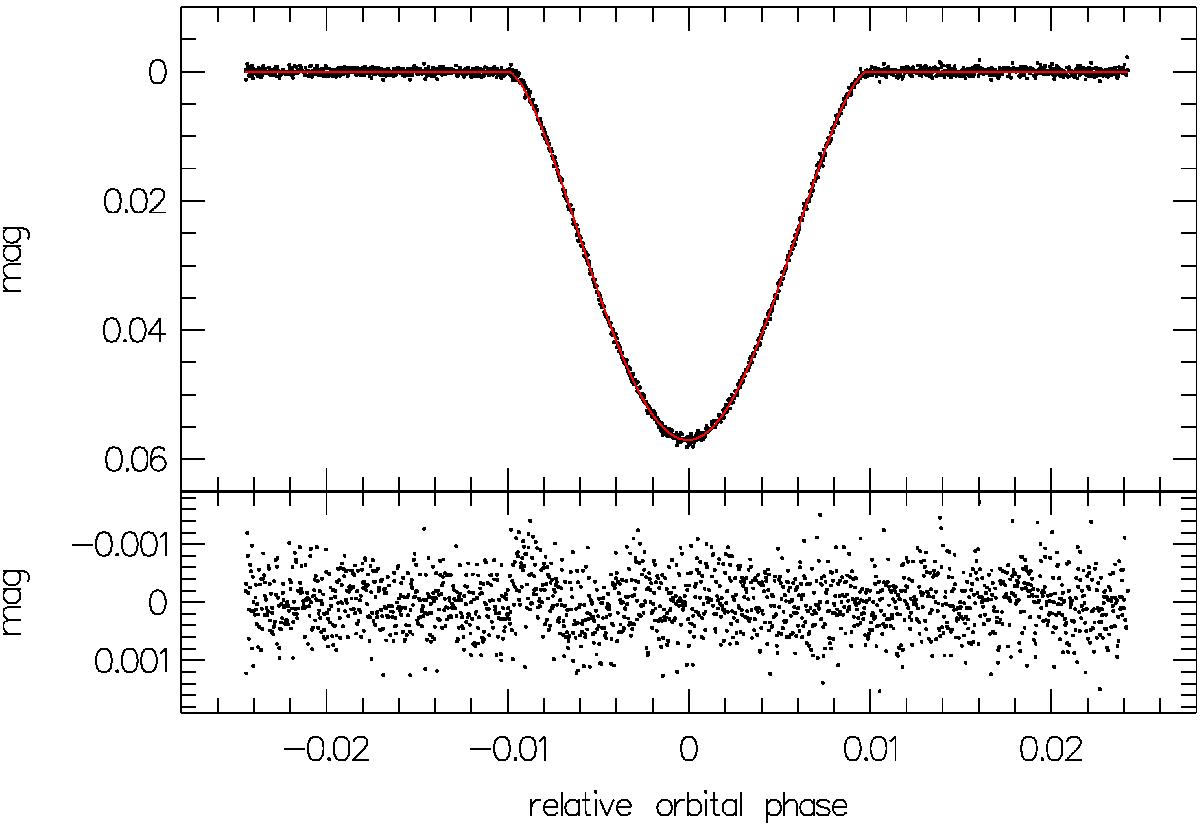
Thirteen eclipse events phase folded and binned in 30 s intervals, and overplotted with the best-fit model (line). In the lower panel the residuals are shown with an rms of 0.47 mmag. We note that in this plot the orbital phase is centered on the mid-time of the eclipse.
Current usage metrics show cumulative count of Article Views (full-text article views including HTML views, PDF and ePub downloads, according to the available data) and Abstracts Views on Vision4Press platform.
Data correspond to usage on the plateform after 2015. The current usage metrics is available 48-96 hours after online publication and is updated daily on week days.
Initial download of the metrics may take a while.