Fig. 2
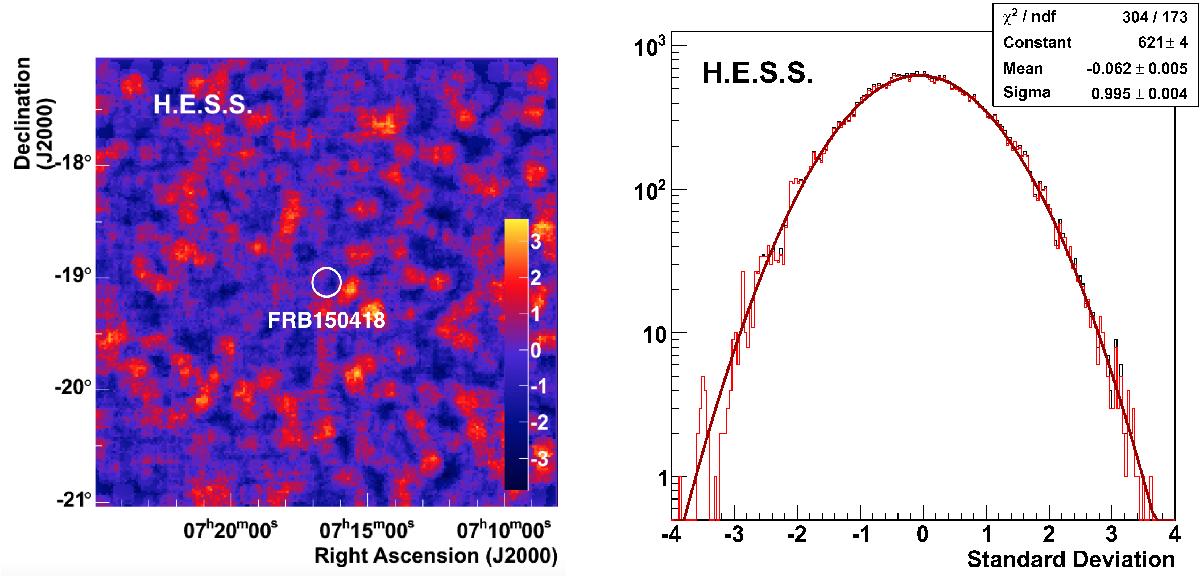
Left plot: map of significances of the gamma ray emission using the formalism proposed by Li & Ma (1983) in the region around FRB150418. The circle in the center has a diameter of 0.24° and denotes the width of the Parkes beam in which the burst was observed. Right plot: distribution of significances (black histogram) compared to the distribution obtained by excluding a circular region of 0.25° radius (red histogram). The red line and the shown parameters correspond to a Gaussian function fit to the latter distribution.
Current usage metrics show cumulative count of Article Views (full-text article views including HTML views, PDF and ePub downloads, according to the available data) and Abstracts Views on Vision4Press platform.
Data correspond to usage on the plateform after 2015. The current usage metrics is available 48-96 hours after online publication and is updated daily on week days.
Initial download of the metrics may take a while.