Free Access
Fig. 7
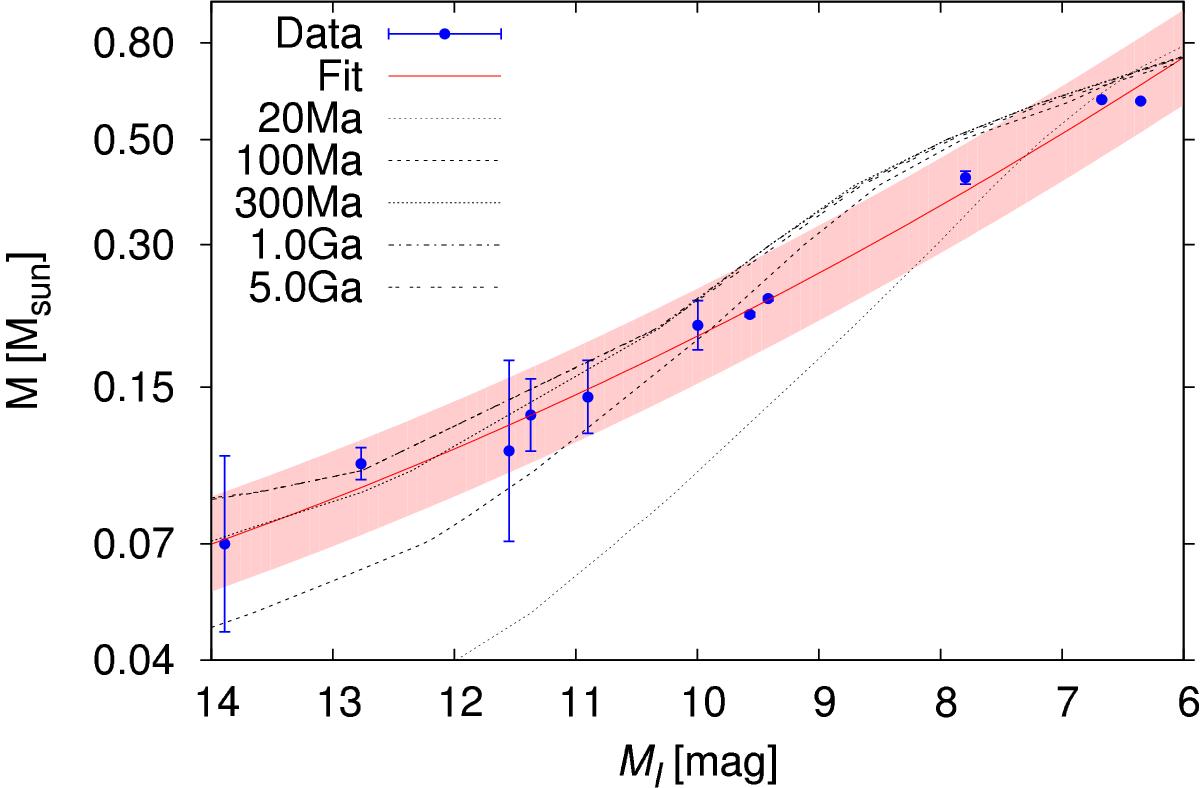
Mass ℳ vs. Absolute magnitude MI. Blue points represent the dynamical masses and absolute magnitudes taken from the literature. The red solid line and shadowed area represent the best-fit ± 3 σ. Different dashed lines display the BT-Settl evolutionary models at 20 Ma, 100 Ma, 300 Ma, 1 Ga, and 5 Ga.
Current usage metrics show cumulative count of Article Views (full-text article views including HTML views, PDF and ePub downloads, according to the available data) and Abstracts Views on Vision4Press platform.
Data correspond to usage on the plateform after 2015. The current usage metrics is available 48-96 hours after online publication and is updated daily on week days.
Initial download of the metrics may take a while.