Free Access
Fig. 6
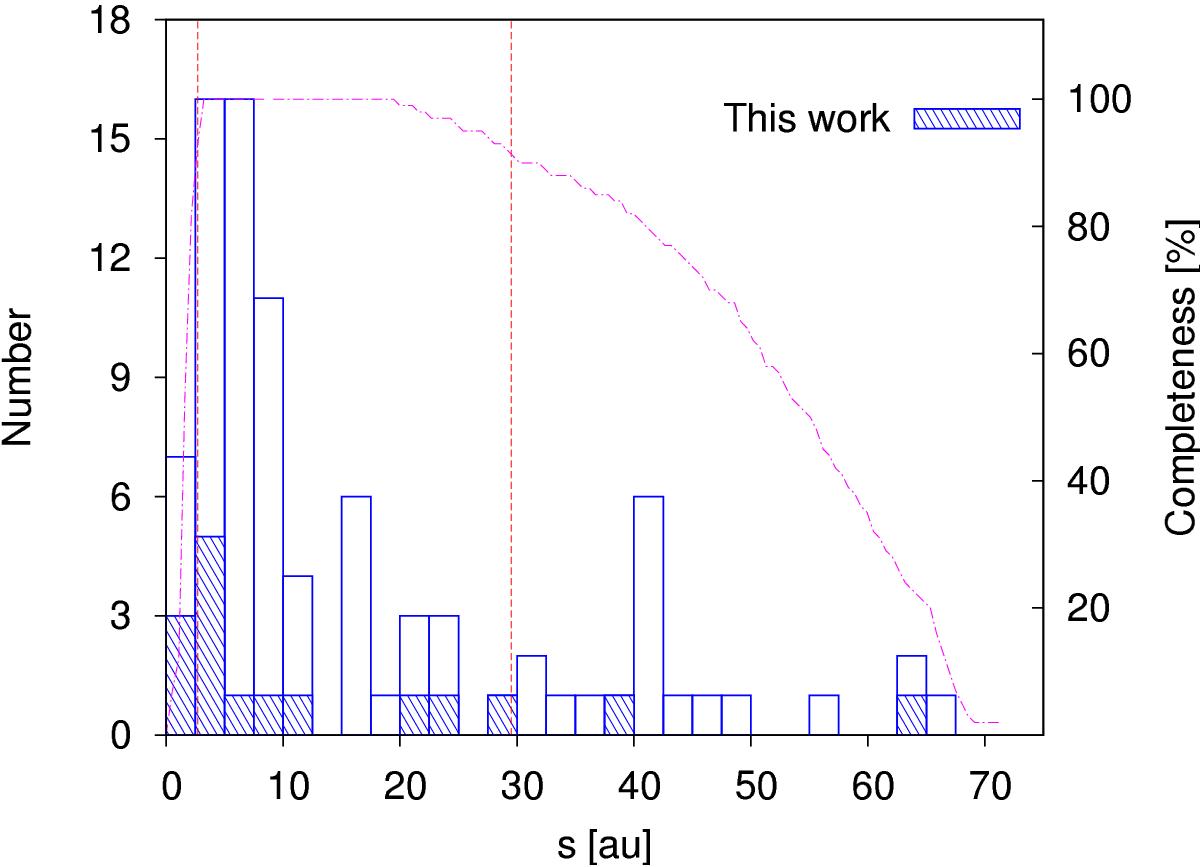
Projected physical separation distribution of the binaries in the volume-limited sample. Dashed bars represent our binaries. Vertical dashed lines mark the 90% completeness limits, and the dash-dotted curve represents the completeness as a function of the projected physical separation.
Current usage metrics show cumulative count of Article Views (full-text article views including HTML views, PDF and ePub downloads, according to the available data) and Abstracts Views on Vision4Press platform.
Data correspond to usage on the plateform after 2015. The current usage metrics is available 48-96 hours after online publication and is updated daily on week days.
Initial download of the metrics may take a while.