Fig. 1
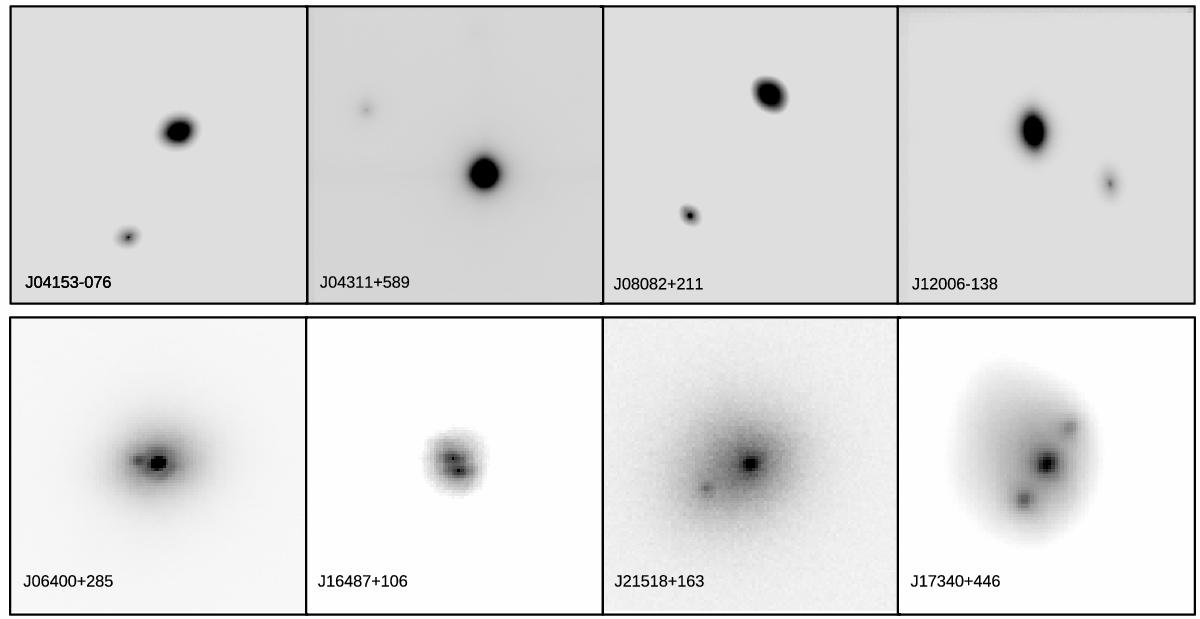
Selection of images of multiple systems identified by us with FastCam. North is up and east is left. The upper row scale is 20 × 20 arcsec2, that of the lower row 4 × 4 arcsec2. Images at the top were obtained with the shift & add mode, while the bottom images were obtained with the lucky image mode. The bottom right image (J17340+446) is an examlpe of the so-called false triple effect.
Current usage metrics show cumulative count of Article Views (full-text article views including HTML views, PDF and ePub downloads, according to the available data) and Abstracts Views on Vision4Press platform.
Data correspond to usage on the plateform after 2015. The current usage metrics is available 48-96 hours after online publication and is updated daily on week days.
Initial download of the metrics may take a while.