Fig. 1
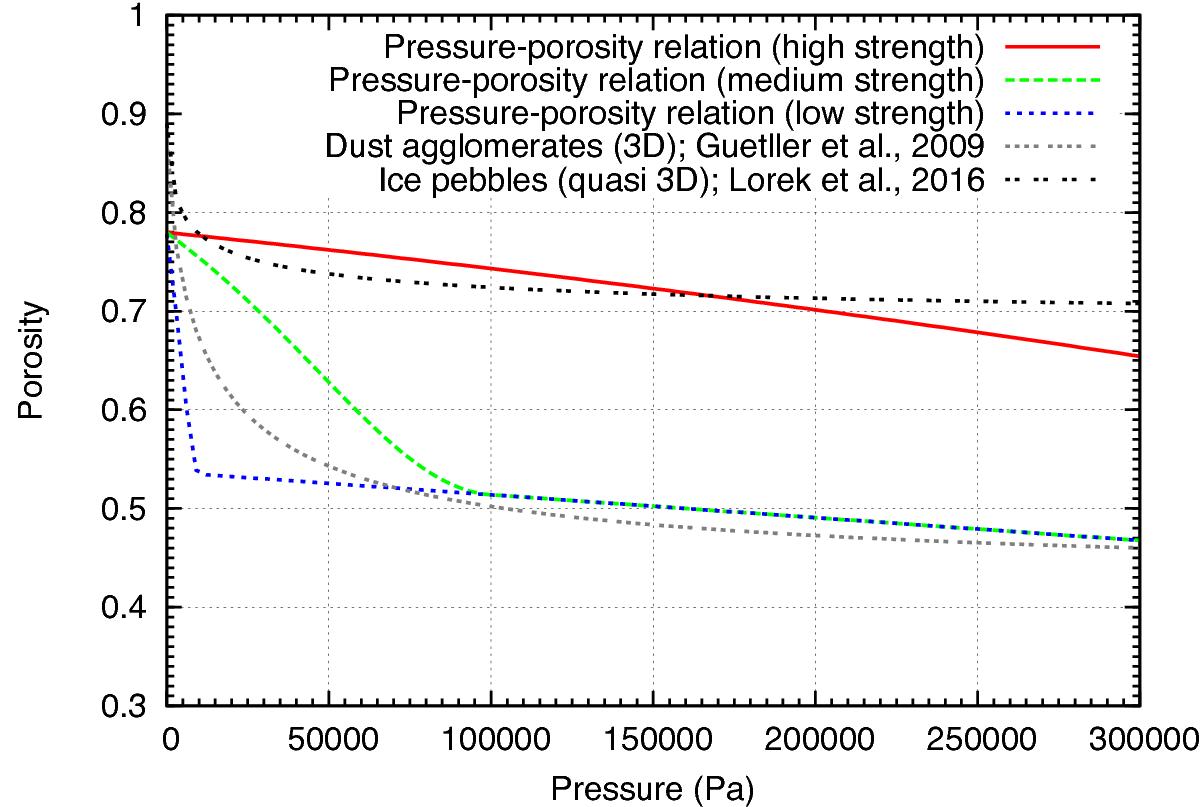
Pressure-porosity relations (crush curve) used in the simulations for the three different sets of parameters (low, medium, high strength) as defined in Table 1. Also shown are the results from laboratory experiments dust agglomerates (Güttler et al. 2009) and ice pebbles (Lorek et al. 2016).
Current usage metrics show cumulative count of Article Views (full-text article views including HTML views, PDF and ePub downloads, according to the available data) and Abstracts Views on Vision4Press platform.
Data correspond to usage on the plateform after 2015. The current usage metrics is available 48-96 hours after online publication and is updated daily on week days.
Initial download of the metrics may take a while.