Fig. 2
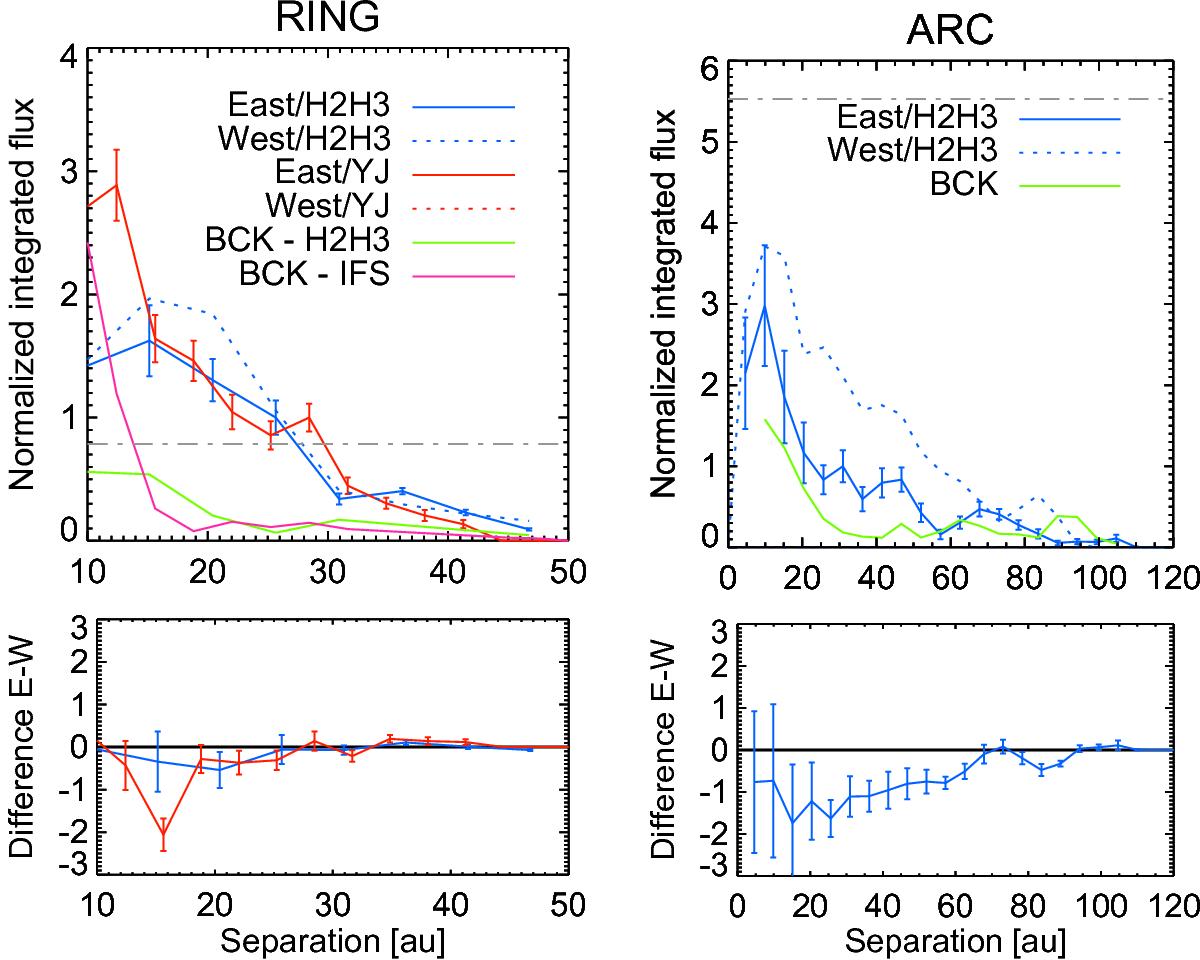
Radial profile along the disk position angle for the ring (left) and for the arc (right), extracted from the H2H3, and YJ PCA images and normalized to the median emission of the east side from 15 to 40 au. The residuals between the East and West disk profiles are shown at the bottom. The normalization is different for the right and left panels. The dot-dashed line corresponds to the cut of Fig. 1.
Current usage metrics show cumulative count of Article Views (full-text article views including HTML views, PDF and ePub downloads, according to the available data) and Abstracts Views on Vision4Press platform.
Data correspond to usage on the plateform after 2015. The current usage metrics is available 48-96 hours after online publication and is updated daily on week days.
Initial download of the metrics may take a while.