Fig. 8
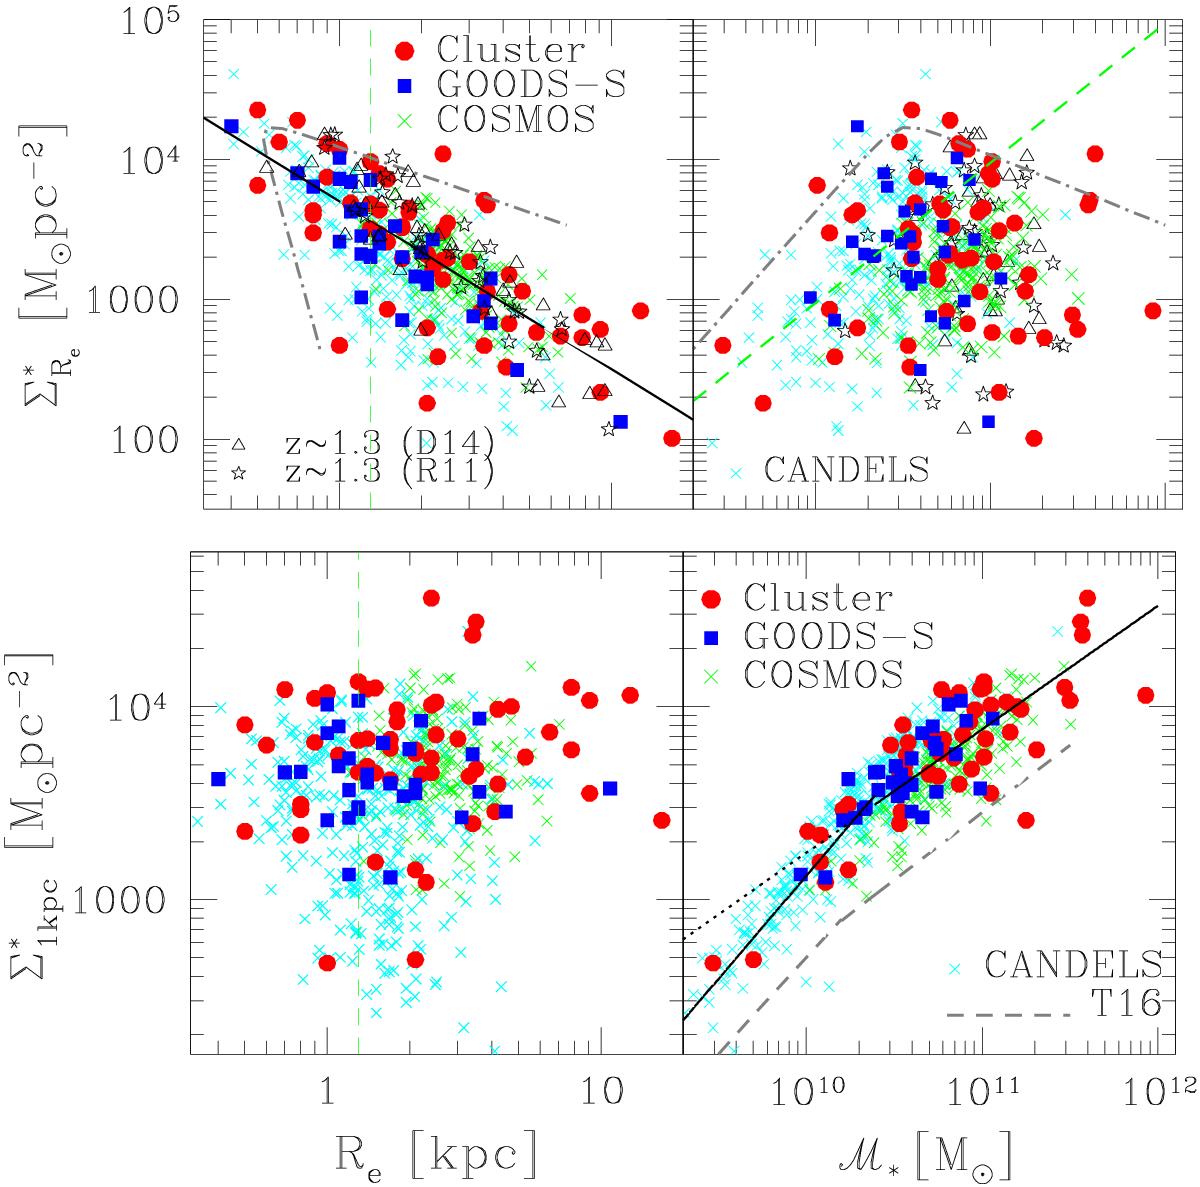
Stellar mass surface density versus effective radius and stellar mass. Upper panel − the effective stellar mass density within the effective radius ![]() , is plotted as a function of the effective radius Re (left) and of the stellar mass ℳ∗ (right). Blue filled squares are field ellipticals in the GOODS-S regions, green crosses are those in the COSMOS area, and red filled circles are cluster ellipticals. The black solid line is the best-fitting relation
, is plotted as a function of the effective radius Re (left) and of the stellar mass ℳ∗ (right). Blue filled squares are field ellipticals in the GOODS-S regions, green crosses are those in the COSMOS area, and red filled circles are cluster ellipticals. The black solid line is the best-fitting relation ![]() (see Appendix A for the orthogonal fit). The green dashed line in the right panel shows the stellar mass density as a function of mass for a constant value of Re = 1.3 kpc (marked on the left panel), corresponding to the limiting value ~0.17 arcsec adopted for the effective radius in the COSMOS catalog of Scarlata et al. (2007). The gray dot-dashed line marks the Zone of Exclusion (ZOE) as defined in Sect. 6.1. The open stars are the early-type galaxies selected by Raichoor et al. (2011; R11) in groups and clusters at z ~ 1.27. The open triangles are the cluster elliptical galaxies at 1.22 <z< 1.4 studied by Delaye et al. (2014; D14).The cyan crosses are the elliptical galaxies from CANDELS. Lower panel − the central stellar mass density calculated within 1 kpc radius (Σ1 kpc) is plotted as a function of the effective radius (left) and of the stellar mass (right). Symbols are as in the upper panel. The solid black line is the best-fitting broken power law
(see Appendix A for the orthogonal fit). The green dashed line in the right panel shows the stellar mass density as a function of mass for a constant value of Re = 1.3 kpc (marked on the left panel), corresponding to the limiting value ~0.17 arcsec adopted for the effective radius in the COSMOS catalog of Scarlata et al. (2007). The gray dot-dashed line marks the Zone of Exclusion (ZOE) as defined in Sect. 6.1. The open stars are the early-type galaxies selected by Raichoor et al. (2011; R11) in groups and clusters at z ~ 1.27. The open triangles are the cluster elliptical galaxies at 1.22 <z< 1.4 studied by Delaye et al. (2014; D14).The cyan crosses are the elliptical galaxies from CANDELS. Lower panel − the central stellar mass density calculated within 1 kpc radius (Σ1 kpc) is plotted as a function of the effective radius (left) and of the stellar mass (right). Symbols are as in the upper panel. The solid black line is the best-fitting broken power law ![]() for ℳ∗>mt and
for ℳ∗>mt and ![]() for ℳ∗<mt, with mt = 2.5 × 10¹⁰M⊙. The gray dashed line is the relation found by Tacchella et al. (2016) with their model of mass growth and quenching, arbitrarily normalized.Errorbars are not shown to observe the agreement among the different samples and the relations defined by the data.
for ℳ∗<mt, with mt = 2.5 × 10¹⁰M⊙. The gray dashed line is the relation found by Tacchella et al. (2016) with their model of mass growth and quenching, arbitrarily normalized.Errorbars are not shown to observe the agreement among the different samples and the relations defined by the data.
Current usage metrics show cumulative count of Article Views (full-text article views including HTML views, PDF and ePub downloads, according to the available data) and Abstracts Views on Vision4Press platform.
Data correspond to usage on the plateform after 2015. The current usage metrics is available 48-96 hours after online publication and is updated daily on week days.
Initial download of the metrics may take a while.