Fig. 6
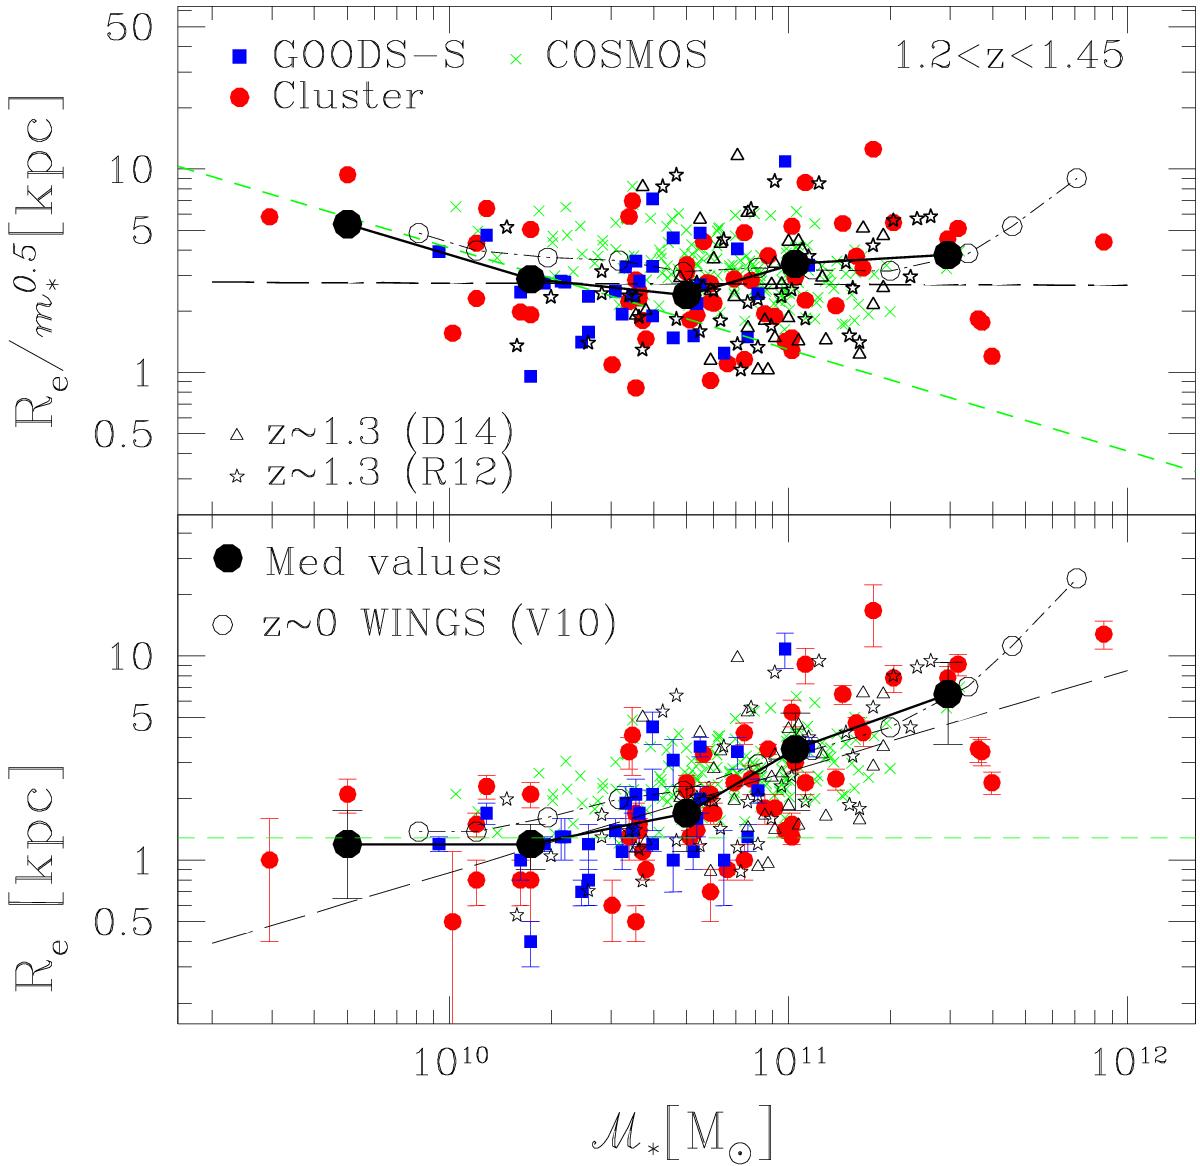
Effective radius-stellar mass relation for elliptical galaxies. Upper panel − the mass normalized radius ![]() is plotted as a function of the stellar mass ℳ∗. The filled symbols are the cluster ellipticals of our sample (red circles), the field ellipticals we selected at 1.2 <z< 1.45 in the GOODS-S field (blue squares), and the ellipticals at 1.0 <z< 1.2 in the COSMOS field (green crosses). Open symbols are data taken from Raichoor et al. (2012; R12, stars), from Delaye et al. (2014; D14, triangles), and from Valentinuzzi et al. (2010 V10, circles; see also Poggianti et al. 2013a). The green short-dashed line is
is plotted as a function of the stellar mass ℳ∗. The filled symbols are the cluster ellipticals of our sample (red circles), the field ellipticals we selected at 1.2 <z< 1.45 in the GOODS-S field (blue squares), and the ellipticals at 1.0 <z< 1.2 in the COSMOS field (green crosses). Open symbols are data taken from Raichoor et al. (2012; R12, stars), from Delaye et al. (2014; D14, triangles), and from Valentinuzzi et al. (2010 V10, circles; see also Poggianti et al. 2013a). The green short-dashed line is ![]() , the line below which there are no measured effective radii in the COSMOS catalog (Sargent et al. 2007). We report errorbars only in the lower panel just for clarity in the plot. Lower panel − the effective radius Re is plotted versus the stellar mass. Symbols are as in the upper panel. The big black filled triangles are the median values of our sample of cluster and field ellipticals at z ~ 1.3. The long-dashed line is the best fitting relation
, the line below which there are no measured effective radii in the COSMOS catalog (Sargent et al. 2007). We report errorbars only in the lower panel just for clarity in the plot. Lower panel − the effective radius Re is plotted versus the stellar mass. Symbols are as in the upper panel. The big black filled triangles are the median values of our sample of cluster and field ellipticals at z ~ 1.3. The long-dashed line is the best fitting relation ![]() over the whole mass range.
over the whole mass range.
Current usage metrics show cumulative count of Article Views (full-text article views including HTML views, PDF and ePub downloads, according to the available data) and Abstracts Views on Vision4Press platform.
Data correspond to usage on the plateform after 2015. The current usage metrics is available 48-96 hours after online publication and is updated daily on week days.
Initial download of the metrics may take a while.