Fig. 10
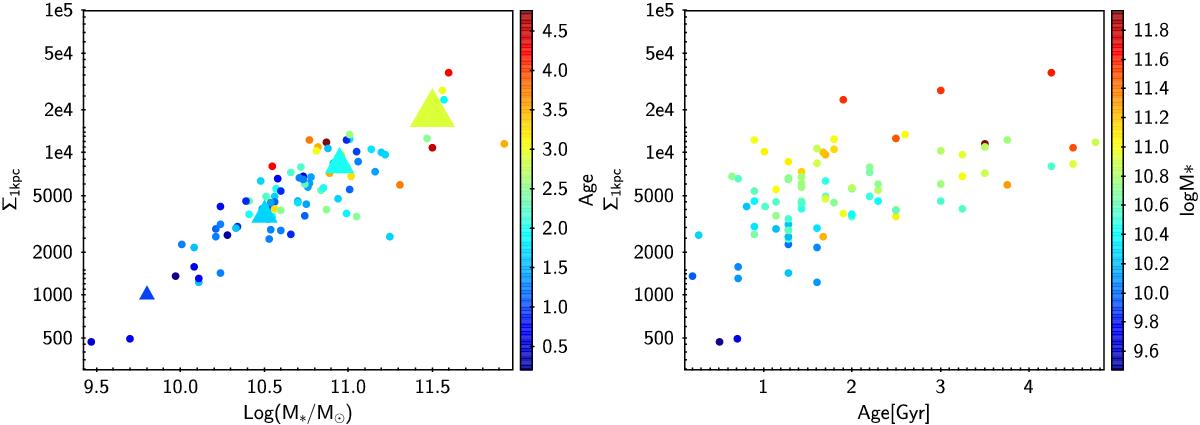
Central stellar mass density Σ1 kpc versus stellar mass (left) and versus age (right). Left − The surface stellar mass density Σ1 kpc within 1 kpc radius is plotted as a function of the stellar mass of the galaxies. The different colors mark the different mean age of the stellar population of the galaxies resulting from the best fitting to their SED. The large colored triangles represent the median age in four bins of stellar mass. Right− The central stellar mass density of cluster and field elliptical galaxies at z ~ 1.3 is plotted as a function of the age of their stellar population. Symbols are colored as a function of stellar mass.Errorbars are not shown to highlight the relationship between the quantities.

Current usage metrics show cumulative count of Article Views (full-text article views including HTML views, PDF and ePub downloads, according to the available data) and Abstracts Views on Vision4Press platform.
Data correspond to usage on the plateform after 2015. The current usage metrics is available 48-96 hours after online publication and is updated daily on week days.
Initial download of the metrics may take a while.