Fig. A.1
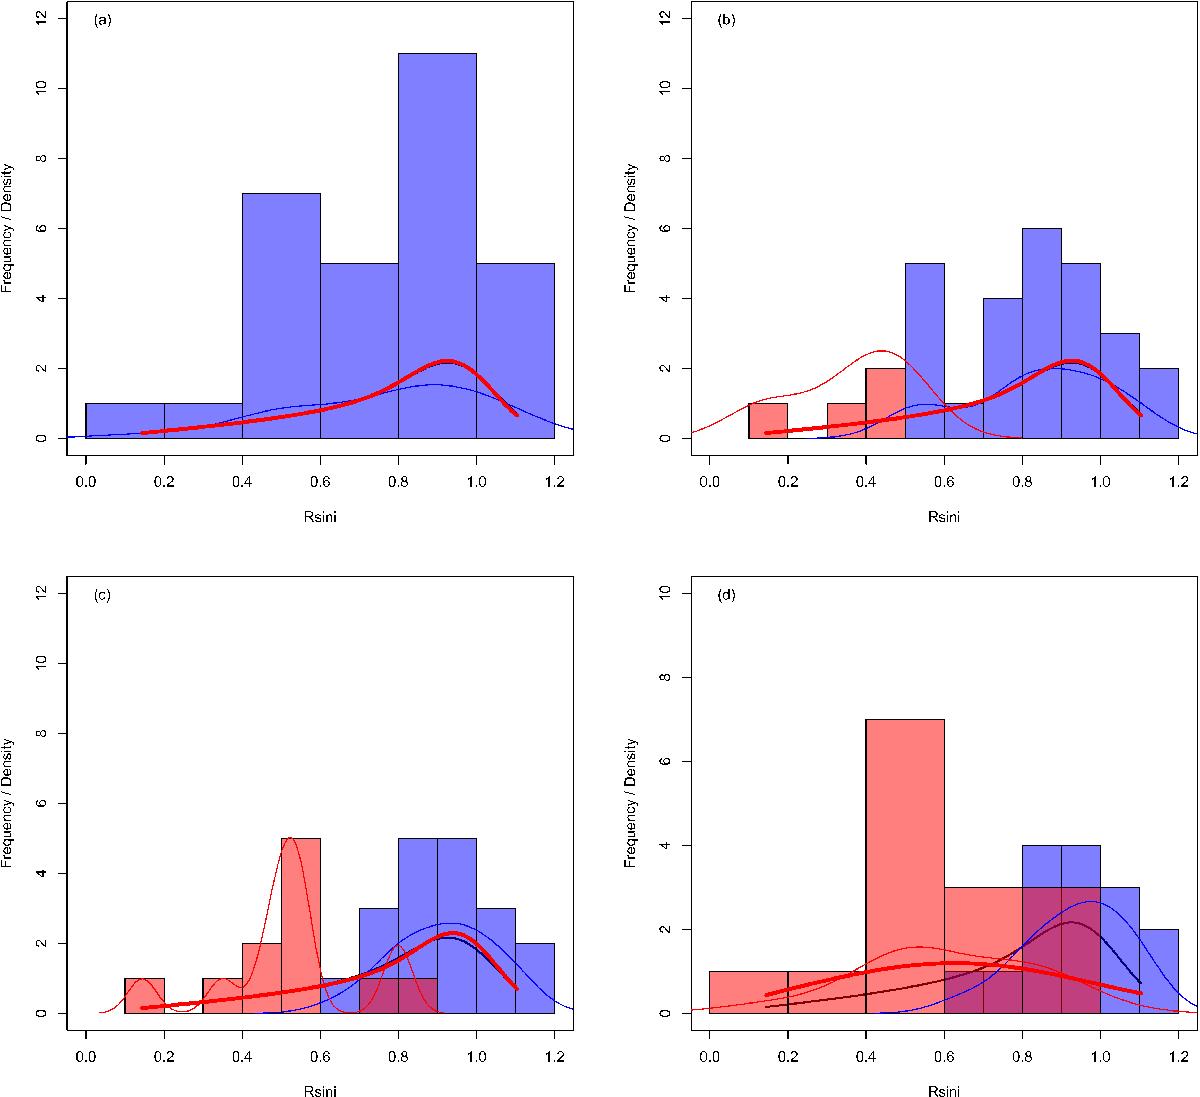
Illustrative tests in recovering ℛ from a synthetic {Rsini} set with censoring. The simulations reproduce n = 30 slow-rotator sequence stars in the Pleiades with M ~ 1 M⊙ and R ~ 1 R⊙ at varying censoring levels: (vsini)lim = 0 (panel a)); 6 (panel b)); 9 (panel c)); 10 (panel d)) km s-1. Blue and red histograms are used for censored and not-censored data. The kernel density estimate is shown as a thin blue line for not-censored data and as a red thin line for censored data, the function φ corresponding to the given synthetic distribution parameters is plotted as a thick black line and that corresponding to the reconstructed parameter as a thick red line. Histograms are representations of frequency.
Current usage metrics show cumulative count of Article Views (full-text article views including HTML views, PDF and ePub downloads, according to the available data) and Abstracts Views on Vision4Press platform.
Data correspond to usage on the plateform after 2015. The current usage metrics is available 48-96 hours after online publication and is updated daily on week days.
Initial download of the metrics may take a while.