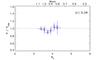
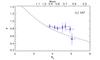
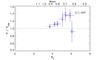
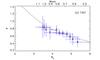
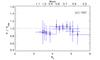
Fig. 3
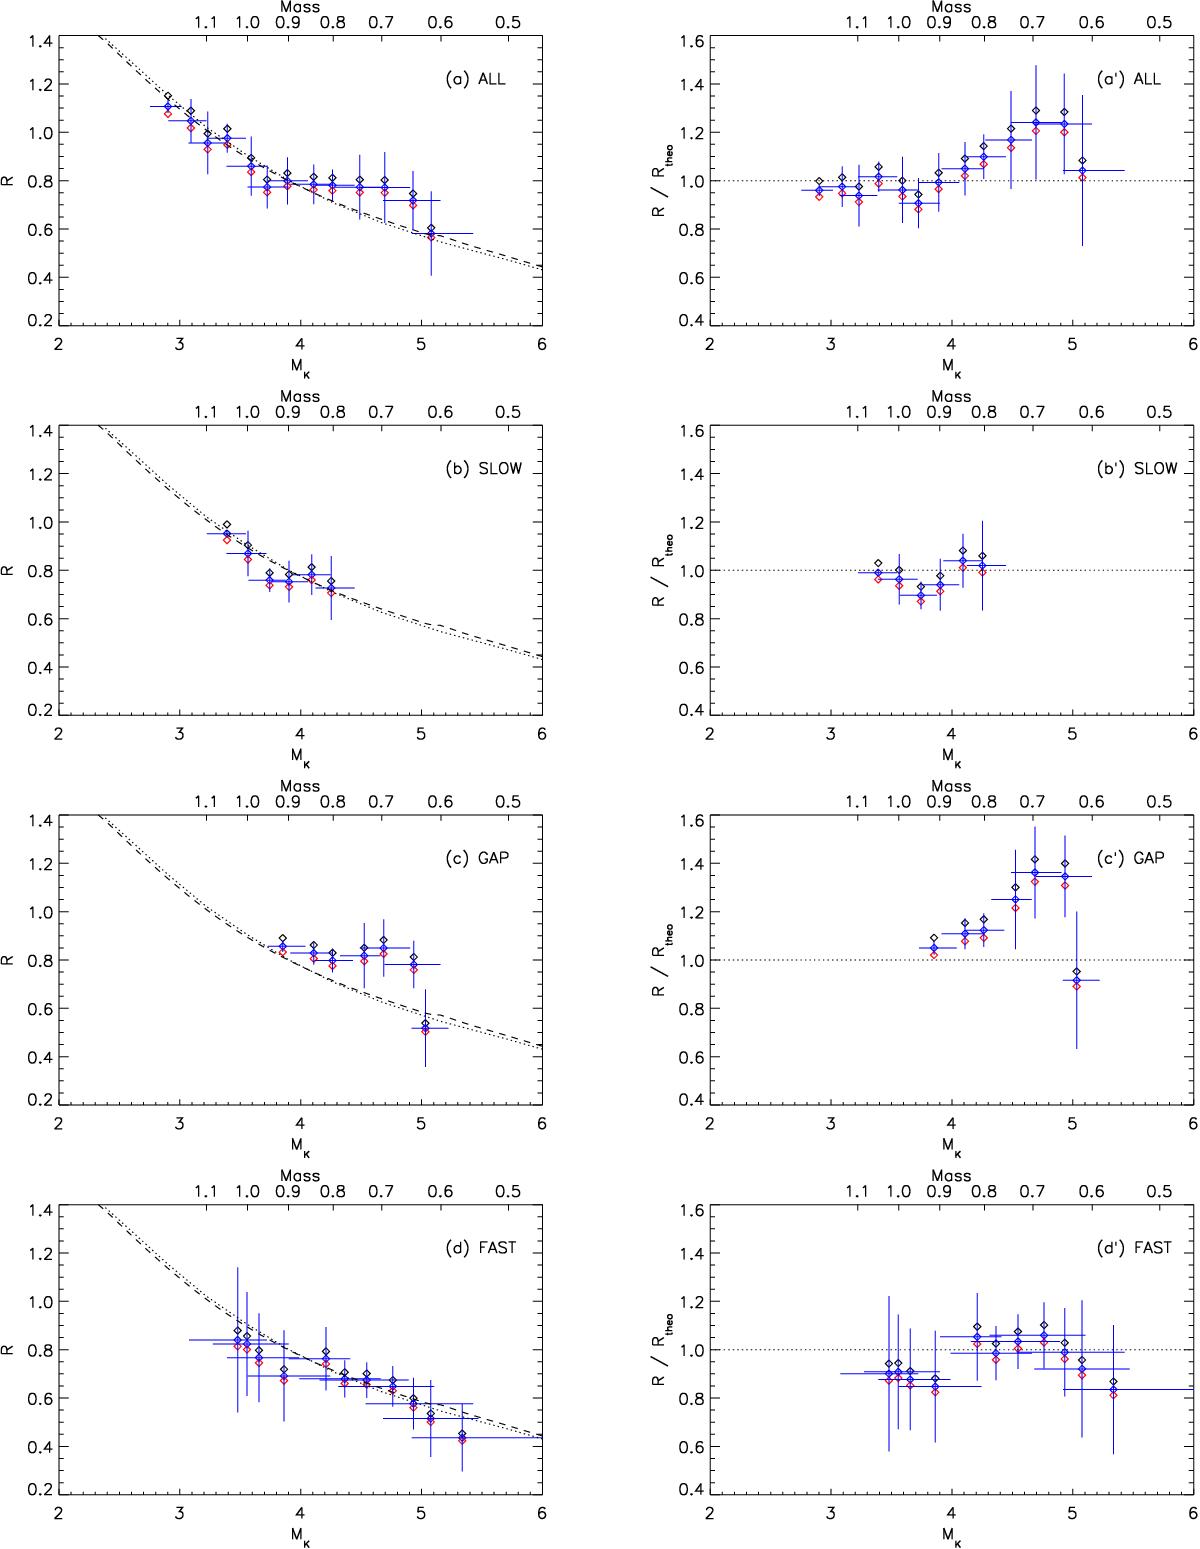
Comparison of the expected radius ℛ with the models of Baraffe et al. (2015; dotted line) and Spada et al. (2013; dashed line). ℛ is reported as a function of the average MK in each bin. The three values of ℛ correspond to our best estimate of the SDR (blue diamond) and the estimated upper and lower SDR limits (black and red diamonds). The horizontal bars encompass the MK range in each bin. The vertical bars represent the standard deviation σ for each bin centred on our best estimate of the SDR. Right panels show the ratio with the Baraffe et al. (2015) model. Panels a) and a′) are obtained using all data, panels b) and b′) for the slow-rotator sequence, panels c) and c′) for stars with periods between fast and slow rotators, panels d) and d′) for fast rotators only (P< 2 d). Bins are ΔM ≈ 0.1 M⊙ wide except for the fast rotators set, for which ΔM ≈ 0.2 M⊙ to ensure that at least ≈10 stars fall in each bin.
Current usage metrics show cumulative count of Article Views (full-text article views including HTML views, PDF and ePub downloads, according to the available data) and Abstracts Views on Vision4Press platform.
Data correspond to usage on the plateform after 2015. The current usage metrics is available 48-96 hours after online publication and is updated daily on week days.
Initial download of the metrics may take a while.