Fig. 4
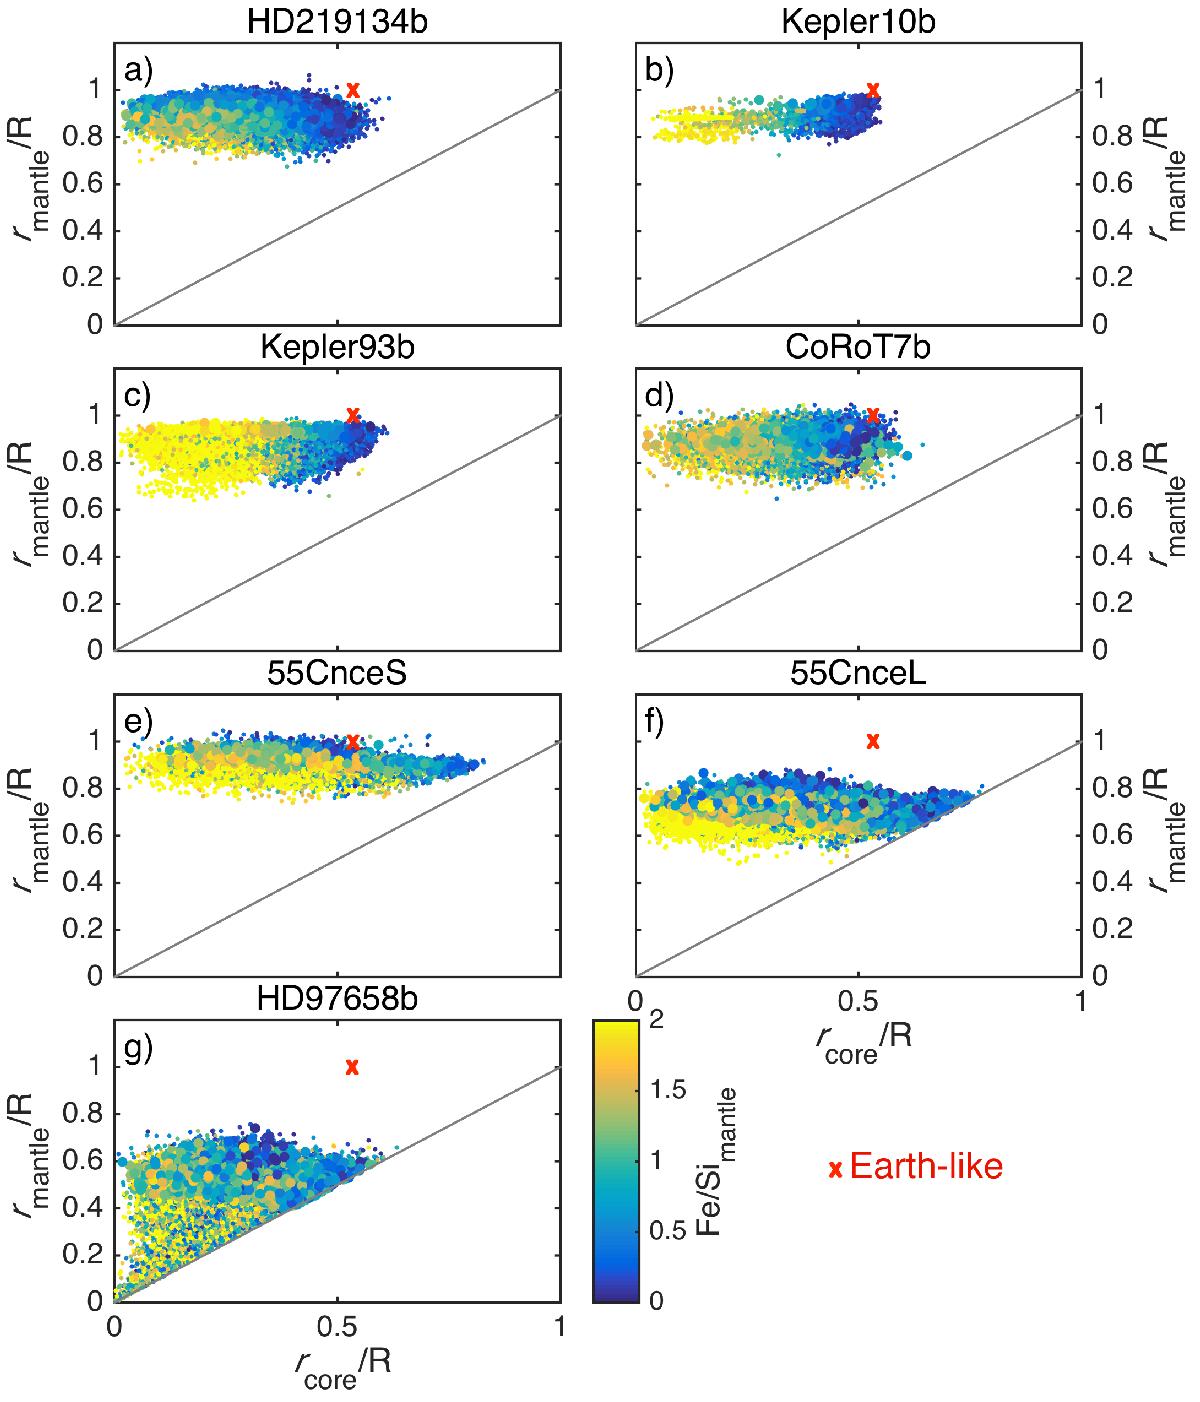
Sampled two-dimensional (2D) marginal posterior pdfs for the six selected exoplanets (a)–f)) showing the correlation between core and mantle sizes, rc, and rmantleand mantle Fe/Simantle. Bigger dots explain the data within 1σ uncertainty. The straight line describes the lower limit of the mantle size where rmantle= rc. Earth-like parameters are depicted by the red cross.
Current usage metrics show cumulative count of Article Views (full-text article views including HTML views, PDF and ePub downloads, according to the available data) and Abstracts Views on Vision4Press platform.
Data correspond to usage on the plateform after 2015. The current usage metrics is available 48-96 hours after online publication and is updated daily on week days.
Initial download of the metrics may take a while.