Fig. 9
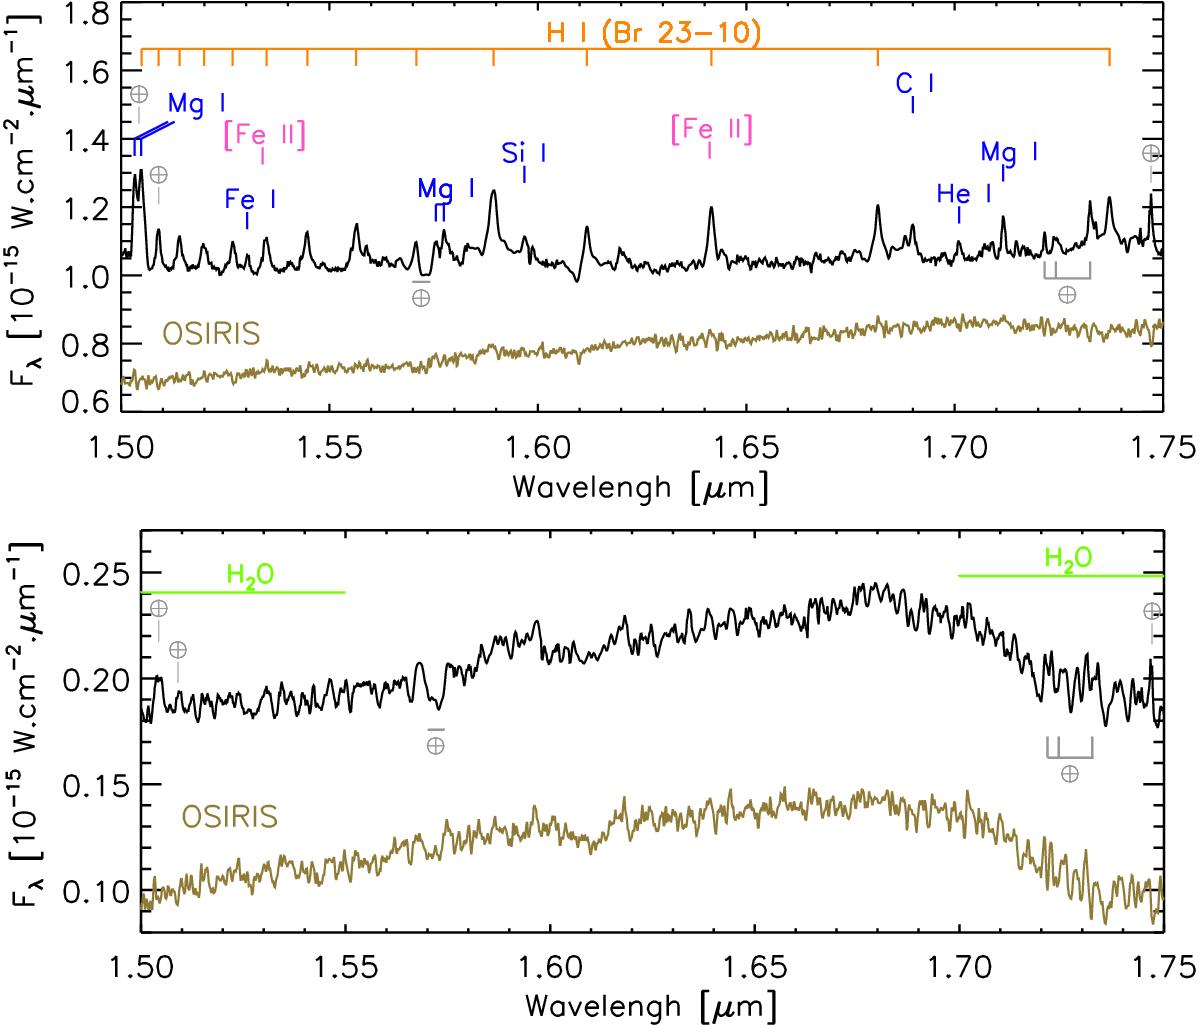
H-band spectra of the Z CMa HBe (top) and FUOR (bottom) components during the outburst phase (black line; SINFONI spectrum from February 6, 2009) and in the quiescent stage (golden line; OSIRIS spectrum from December 22, 2009). The fluxes of the OSIRIS spectra are normalized to the median flux of the SINFONI spectra between 1.66 and 1.70 μm and shifted to lower values for clarity.
Current usage metrics show cumulative count of Article Views (full-text article views including HTML views, PDF and ePub downloads, according to the available data) and Abstracts Views on Vision4Press platform.
Data correspond to usage on the plateform after 2015. The current usage metrics is available 48-96 hours after online publication and is updated daily on week days.
Initial download of the metrics may take a while.