Fig. 7
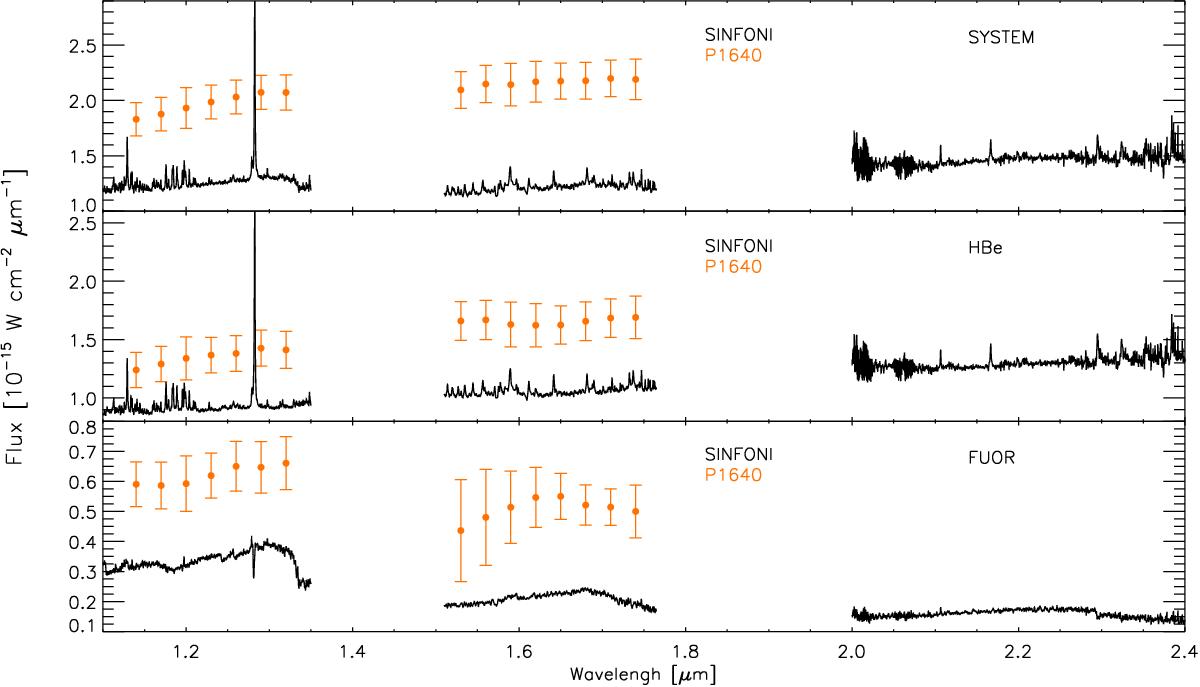
Flux-calibrated SINFONI spectra (from February 6, 2009) of the system (top), the HBe component (middle), and of the FUOR (bottom) in the 1.1−2.4 μm range while the binary was in outburst. The lower resolution (R ~ 45) P1640 spectrum of the system components also acquired during the outburst phase (March 17, 2009, Hinkley et al. 2013) is shown in orange.
Current usage metrics show cumulative count of Article Views (full-text article views including HTML views, PDF and ePub downloads, according to the available data) and Abstracts Views on Vision4Press platform.
Data correspond to usage on the plateform after 2015. The current usage metrics is available 48-96 hours after online publication and is updated daily on week days.
Initial download of the metrics may take a while.